QBTS 48-day bearish forecast — Nov 15, 2026
- Bias: Bearish
- Timeframe: 48 days (made Nov 15, 2026, target date Jan 1, 2027)
- Price at analysis: $9.56
- Price target: $8.70
- Expected range: $7.20 – $10.90
- Result: Pending — graded after the close on Jan 1, 2027
Get a free AI analysis of QBTS today
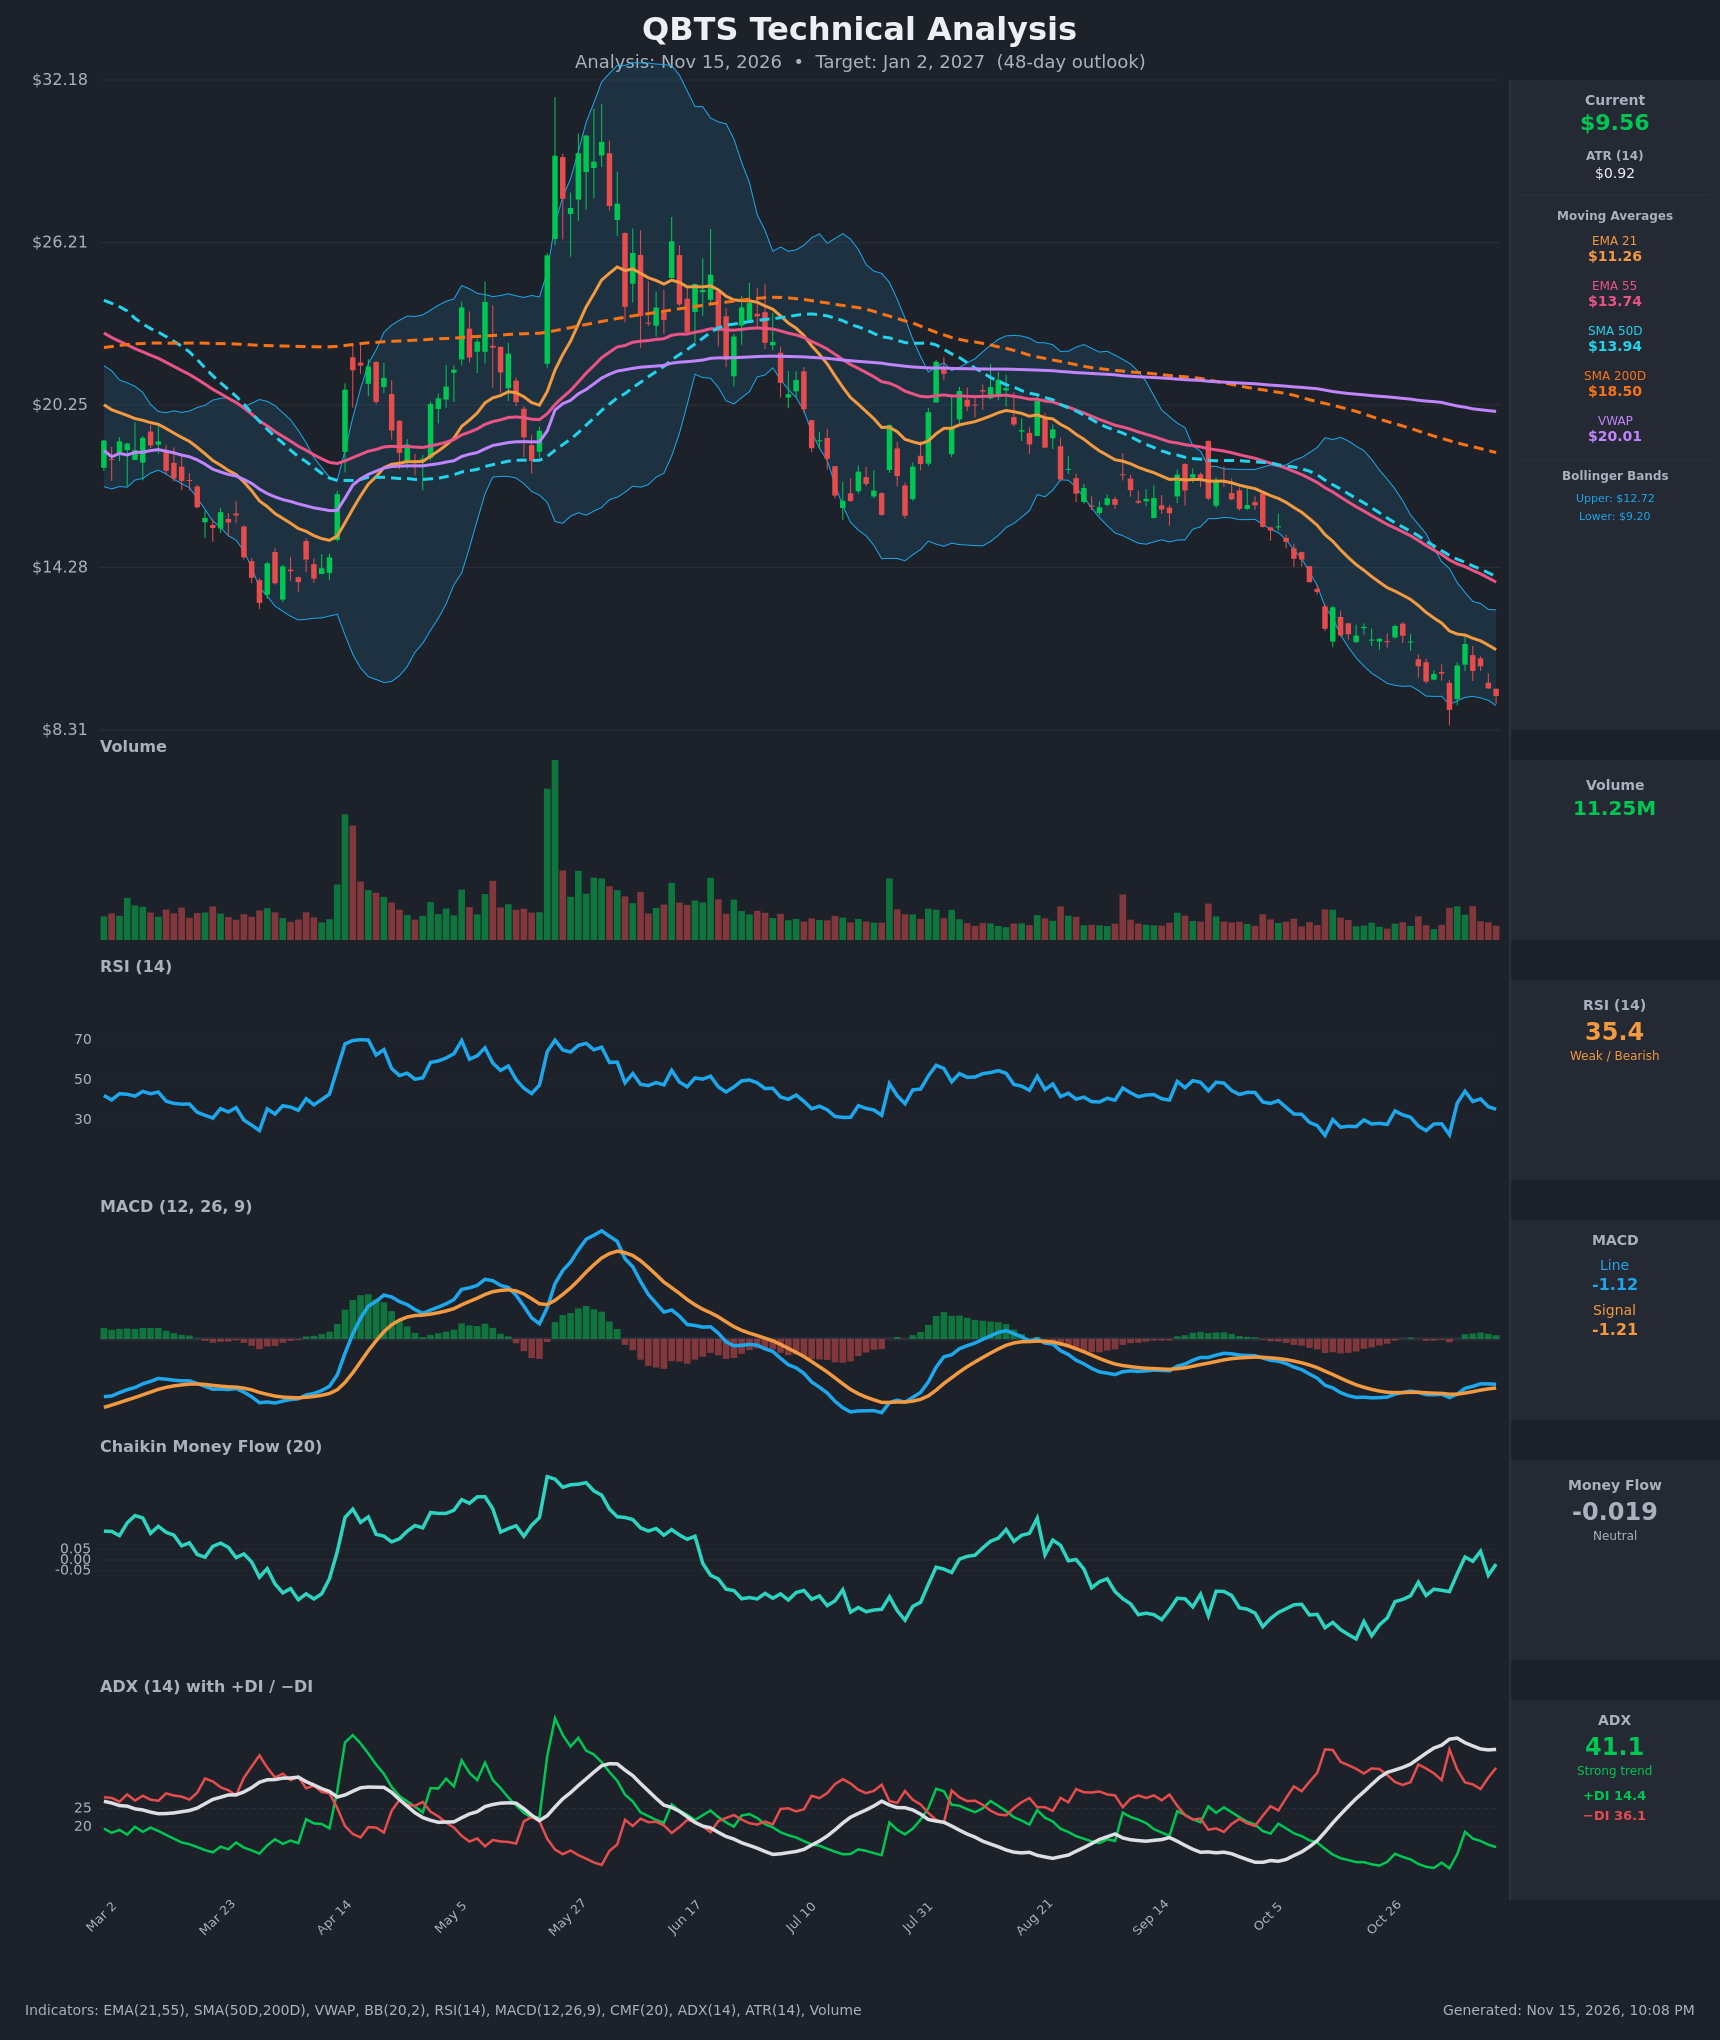
Analysis
TECHNICAL INDICATORS
- RSI (14): 35.35, below the neutral 50 line and close to oversold. It bounced from 22.6 on Nov 5 to 44.4 on Nov 9, then rolled over and made lower highs (44.4 → 40.5 → 35.4). Momentum is weak, and the failed recovery favors sellers. [Bearish]
- 20 EMA: The chart uses EMA 21 at $11.26. Price at $9.56 is about 15% below it, and the EMA is sloping down (from $13.54 on Oct 26). Price sits below EMA21 ($11.26), EMA55 ($13.74), SMA50D ($13.94), SMA200D ($18.50) and VWAP ($20.01), so every level above is stacked resistance. [Bearish]
- MACD: The line (-1.12) is slightly above the signal (-1.21), so the histogram is marginally positive (~+0.09). The line has been below zero for weeks, which is a weak bullish crossover inside a bearish regime. It flattened in the last two bars (-1.110 → -1.112 → -1.122) and is starting to roll over, so the crossover is losing steam. [Neutral]
- Bollinger Bands (20): Price at $9.56 is near the lower band ($9.20) and far below the upper band ($12.72). A bar tagged below the lower band on Nov 5 ($9.05). The bands are sloping down, so this is a "band walk" in a downtrend. A bounce toward the $11.26 midline is possible but not guaranteed. [Bearish]
- CMF (20): -0.019, inside the neutral zone (±0.05). It has improved from -0.273 on Oct 26 and flickered slightly positive (+0.041 on Nov 11), so selling pressure has eased but there is no real accumulation. [Neutral]
- ADX (14): 41.1 with −DI (36.1) far above +DI (14.4). ADX has risen from ~35 to above 40 and is flattening near the peak. This is a strong, mature downtrend with bears in control, though a flat or falling ADX from here would hint at exhaustion. [Strong Trend – Bearish]
- Volume: 11.25M, light compared with the spike bars in April and May. The recent bounce (Nov 6/9) came on modest volume and was sold into, which shows weak demand. There is no capitulation spike yet. [Bearish – lack of buying conviction]
DIVERGENCES & TRENDS
- Moving average structure: The full bearish stack is in place (price < EMA21 < EMA55 < SMA50D < SMA200D < VWAP). SMA50D ($13.94) is well below SMA200D ($18.50), a death cross that is already established and still widening.
- RSI: It made a lower low (22.6 on Nov 5) at roughly the same price area as the $9.05 low and has since failed to regain 45. There is no confirmed bullish divergence, but momentum is stabilizing relative to the price lows. MACD held around -1.1 to -1.4 while price dropped, which hints at slowing downside momentum.
- MACD: A mild bullish crossover on Nov 9-10 below the zero line is a low-reliability signal, since the histogram is already shrinking.
- CMF: It has trended up from -0.27 to roughly neutral, a mild positive divergence against falling price. It has not confirmed accumulation.
- ADX/DI: −DI dominates and +DI has not crossed back above it. The failed +DI spike to 18.6 on Nov 9 shows bulls could not take control.
- Price trend: Lower highs and lower lows since the ~$30 peak in May. The price path since August has been a steady decline.
CHART PATTERNS
- Primary pattern: A long-term downtrend with a Bearish Head and Shoulders structure on the daily chart. The May peak is the head, with a lower shoulder in August, and the neckline break around $17-18 in September/October opened the leg down. The measured move is large and is largely realized.
- Recent consolidation: The sideways action between ~$9 and ~$12 since late October resembles a small Bearish Pennant / Flag under falling EMAs, a continuation pattern in a down move. A break below $9.05-$9.20 would target roughly $7.50-$8.00.
- Counter-case: A possible Bullish Double Bottom is forming around $9.05-$9.50 (lows on Nov 5 and Nov 13). It would need a close above ~$11.50 (the Nov 9 high and EMA21 area) to confirm, targeting the $13.70-$14 zone.
POTENTIAL SCENARIOS
- Scenario 1: Bearish Trend Continuation — Price breaks the double-bottom zone and keeps walking down the lower Bollinger Band with −DI dominant and every MA acting as resistance. Trigger: Daily close below $9.05 (Nov 5 low). Target: $7.50-$8.30. Invalidation: Daily close above $11.30 (EMA21). (50% probability)
- Scenario 2: Bullish Oversold Bounce / Double Bottom — RSI is oversold-adjacent, CMF is neutral and price is near the lower band, so a relief rally toward the EMA21 and EMA55 is possible. Trigger: Close above $10.70 with volume, then above $11.50. Target: $11.30-$13.00 (EMA21 to EMA55/SMA50D). Invalidation: Close below $9.00. (30% probability)
- Scenario 3: Neutral Range — Price chops between $9.00 and $11.50 as ADX cools from extreme levels. Trigger: Failed breaks on both sides. Target: $9.50-$11.00. Invalidation: Close outside $8.80-$11.80. (20% probability)
PRICE TARGETS
For the 48-day horizon (target date around Jan 2, 2027), the downtrend is strong (ADX 41, −DI 36), but price is already stretched at the lower band, which caps the downside conviction. I expect a modest further drift lower with a wide two-sided range because of the high volatility (ATR $0.92, about 9.7% of price).
- Target Price: $8.70
- Expected Range: $7.20 to $10.90 (width $3.70, about 38.7% of current price; this is wider than the standard 12-18% guide for a 30-60 day window because this stock has very high volatility, ATR about 9.7% of price, and a two-sided risk of a bounce or a breakdown)
- Key Levels: Support at $9.05 (Nov 5 low; next $8.30), Resistance at $11.26 (EMA21; next $11.50)
OVERALL BIAS
OVERALL BIAS: BEARISH - Price is below every moving average and VWAP, with a death cross in place, ADX at 41 and −DI far above +DI, and bounces are being sold on light volume. The oversold-adjacent RSI and neutral CMF argue for a possible bounce, but the weight of evidence favors continued weakness toward the $8-$9 area.
This is educational analysis and not financial advice.