QBTS 62-day bearish forecast — Nov 15, 2026
- Bias: Bearish
- Timeframe: 62 days (made Nov 15, 2026, target date Jan 15, 2027)
- Price at analysis: $9.56
- Price target: $8.40
- Expected range: $6.50 – $11.50
- Result: Pending — graded after the close on Jan 15, 2027
Get a free AI analysis of QBTS today
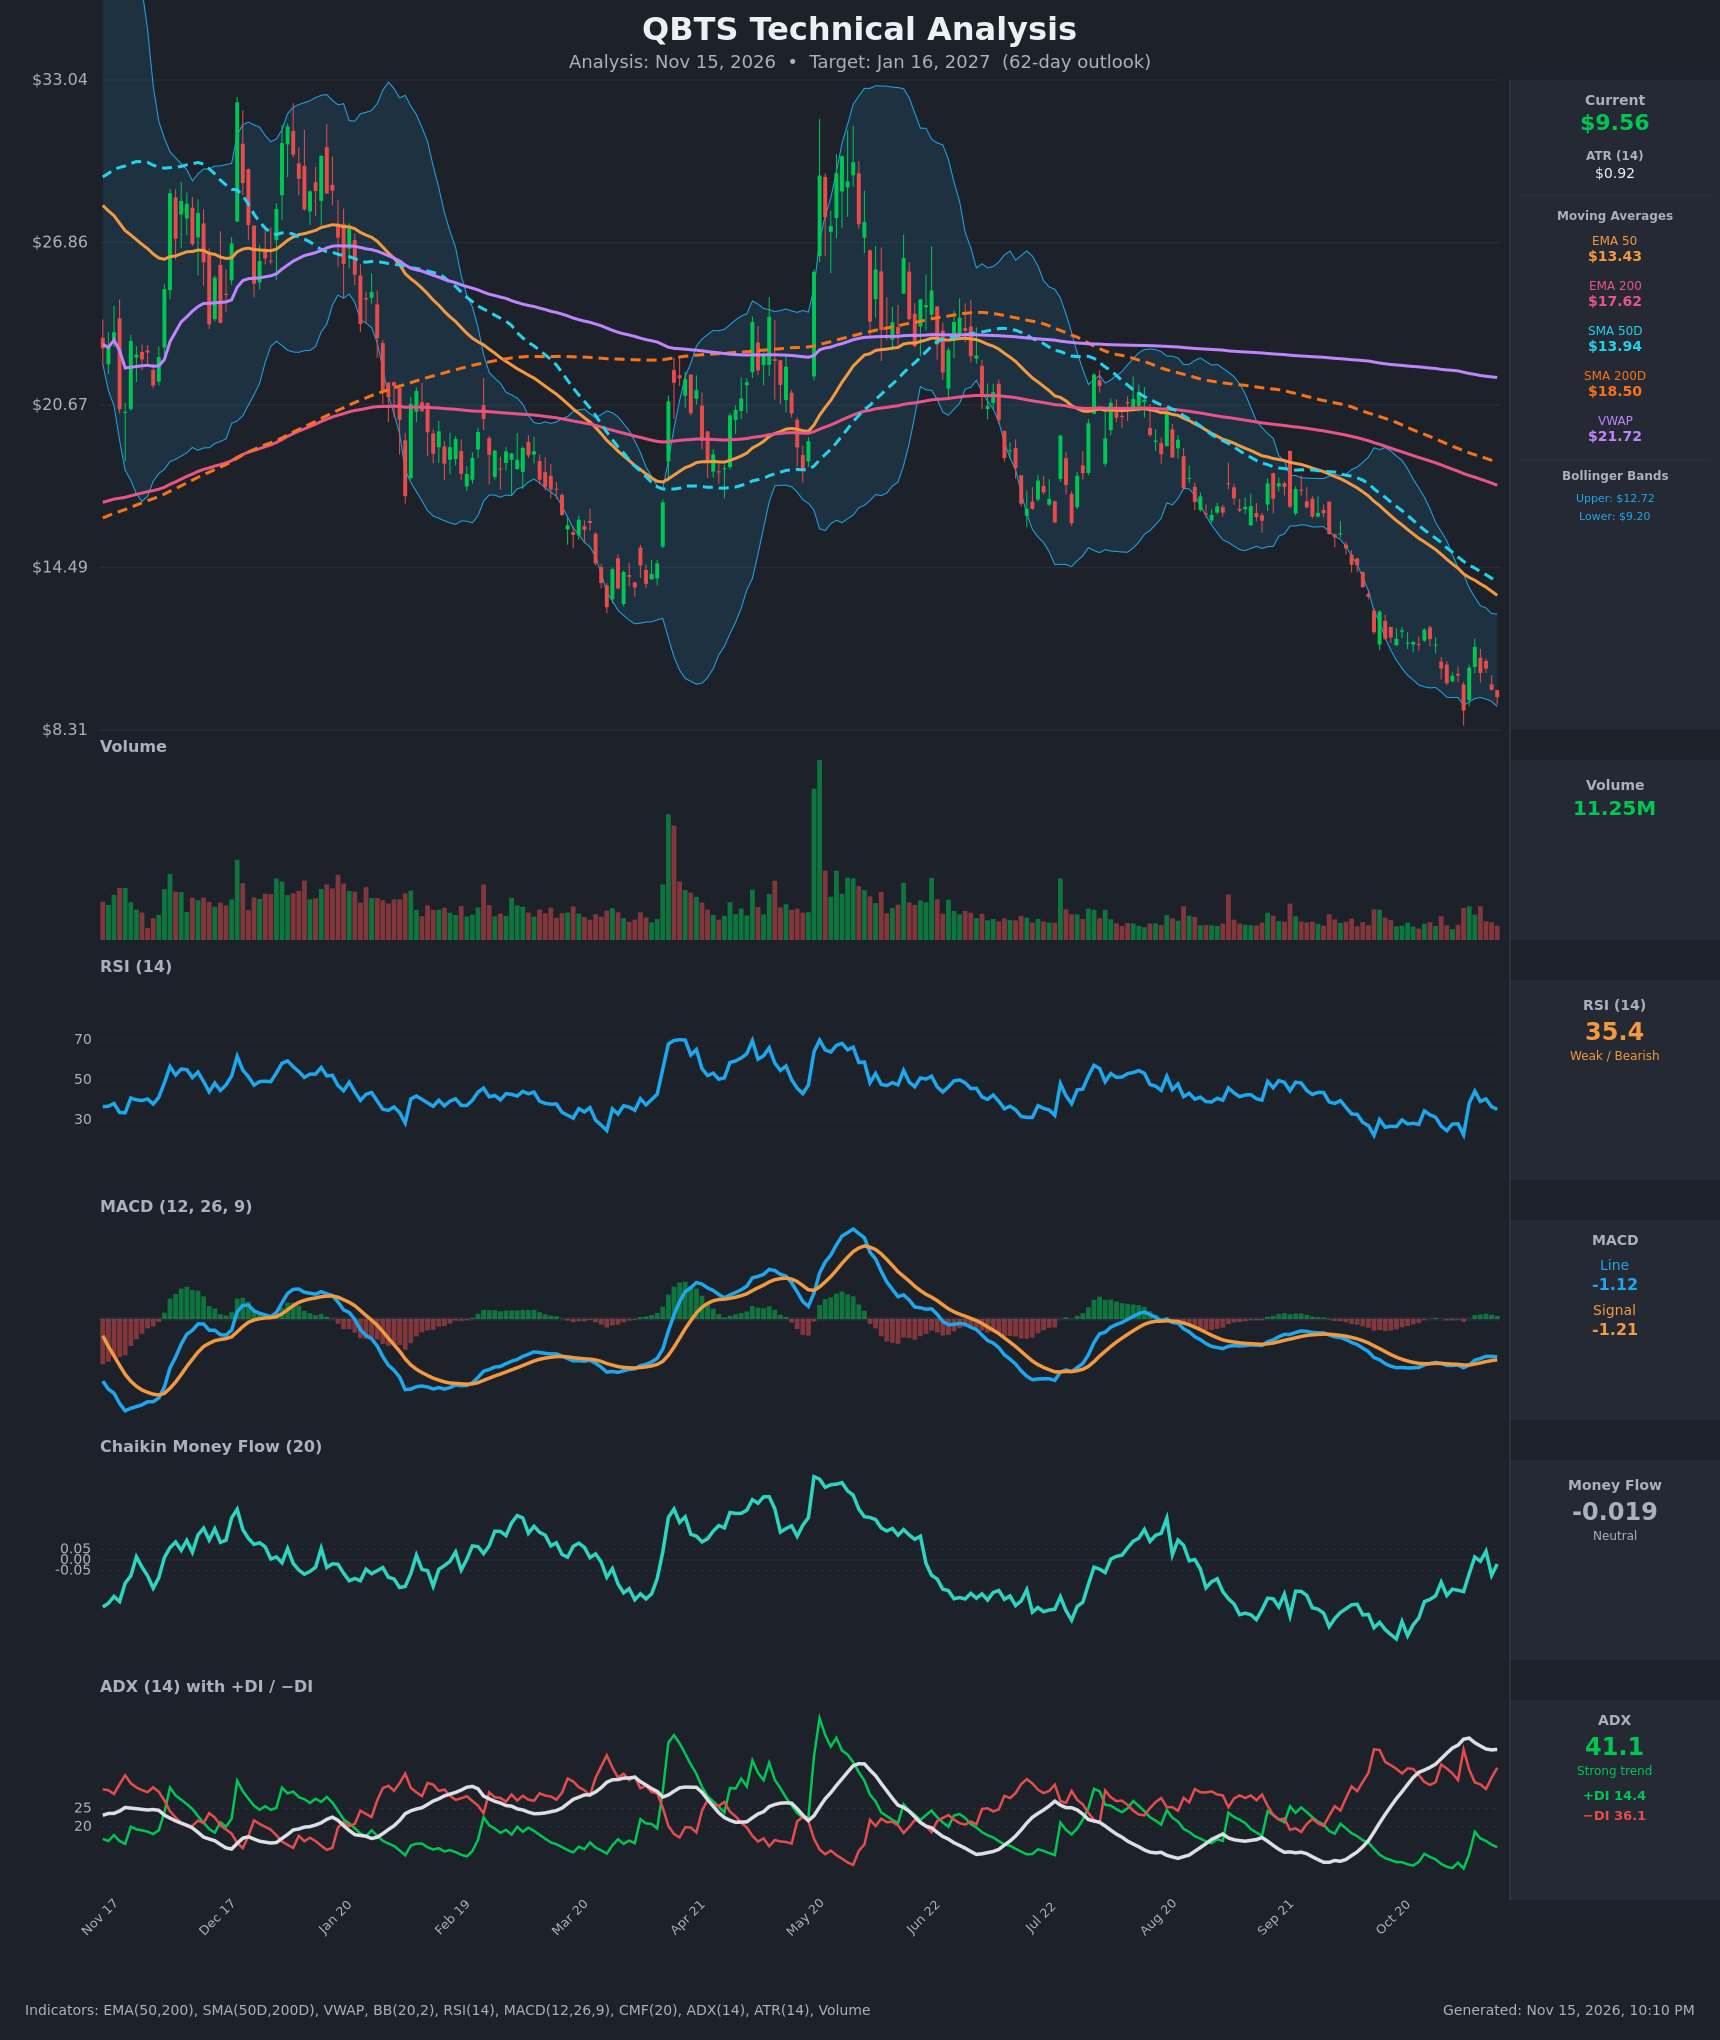
Analysis
TECHNICAL INDICATORS
- RSI (14): 35.35, below the neutral 50 line and just above oversold. It bounced from 22.6 on Nov 5 to 44.4 on Nov 9, then rolled over again to 35.4. The sequence of lower highs shows momentum fading on each rally. [Bearish]
- 20 EMA: The 20 EMA isn't supplied. The 50 EMA at $13.43 and 200 EMA at $17.62 both sit far above the $9.56 price and are sloping down, so they act as heavy overhead resistance. Price is about 29% below the EMA 50. [Bearish]
- MACD: Line -1.1225 vs signal -1.2127, so the histogram is slightly positive (+0.09). The line crossed above the signal on Nov 6 to Nov 9. The crossover is shallow and happens deep below zero. It is a weak bounce signal and not a trend reversal, and the line is flattening again at -1.12. [Neutral]
- Bollinger Bands (20): Price at $9.56 is near the lower band ($9.20), well below the middle band (~$10.96) and the upper band ($12.72). The close on Nov 5 ($9.05) pierced the lower band. Walking the lower band in a strong downtrend is a continuation signal, though it also stretches the move toward a mean-reversion bounce. [Bearish]
- CMF (20): -0.019, which is neutral (between ±0.05). It has improved from -0.273 on Oct 26 and briefly turned positive (+0.041 on Nov 11). Selling pressure has eased but there is no accumulation. [Neutral]
- ADX (14): 41.1 and rising, a strong trend. −DI (36.1) is far above +DI (14.4), so bears are firmly in control. +DI's brief rise to 18.6 failed, and the DIs are re-widening. [Strong Trend – Bearish]
- Volume: 11.25M, subdued and well below the spike volumes of earlier this year. Down moves on moderate volume with no capitulation spike suggest a grinding decline and not a washout. Volume gives no sign of a selling climax or a bottom. [Neutral to mildly bearish]
DIVERGENCES & TRENDS
- Price vs. RSI: There's no bullish divergence yet. Price made a new low at $9.05 on Nov 5 with RSI at 22.6, and the latest low at $9.56 comes with RSI at 35, which is higher than the prior trough. This is a mild early positive RSI divergence but it is unconfirmed.
- MACD: The MACD trough (-1.449) was flatter than earlier lows, and the line is holding just above the signal. This hints at decelerating downside momentum, not a reversal.
- Moving averages: The price is below every moving average. EMA 50 ($13.43) is below EMA 200 ($17.62), and SMA50D ($13.94) is below SMA200D ($18.50). Both pairs are bearish and the death cross is well established. The series is still sloping downward.
- VWAP: At $21.72, VWAP is more than twice the current price, so anyone holding from the average level is deeply underwater. That is persistent overhead supply.
- ADX/DI: ADX has risen from about 35 to 41 over the last 15 bars while −DI stays dominant. The bearish trend is intensifying and not exhausting.
- Structure: A sequence of lower highs and lower lows has run since the May peak (~$30). Price broke below the mid-year range and the $14 to $17 area.
CHART PATTERNS
- Primary pattern: A sustained downtrend with a descending channel bounded by falling highs. The recent consolidation around $10 to $12 resembles a Bearish Pennant / Bearish Flag continuation (reference diagram, continuation row), with the measured move pointing lower.
- Bearish continuation: The prior leg ran from about $17 to $11.5, a pole of about $5.5. A breakdown from the pennant near $9.0 to $9.2 would project toward the $5.50 to $6.50 area as a maximum extension, though I treat the full measured move as a tail outcome in 62 days.
- Possible bullish alternative: If price holds $8.3 to $9.0 and forms a Double Bottom (Nov 5 low $9.05 and a retest), the neckline is near $11.5 to $12 (Nov 9 high $11.47, upper Bollinger band). That is the main bullish reversal condition and it has not formed yet.
- Significance: Pattern evidence favors continuation. The bounces have been shallow, and each one has hit resistance faster.
POTENTIAL SCENARIOS
- Scenario 1: Bearish Trend Continuation — The −DI-dominated trend (ADX 41) persists and price breaks the $9.05 low and the $8.31 chart low. Rallies stall under the declining EMA 50 / lower-to-mid Bollinger zone ($11 to $12). Trigger: daily close below $9.00 on rising volume. Target: $7.00 to $8.00 (further extension toward $6.50). Invalidation: daily close above $12.00 to $12.70 (upper Bollinger band). (50% probability)
- Scenario 2: Neutral Base-Building Range — Price stabilizes at $8.50 to $11.50, forming a Double Bottom as selling pressure eases (CMF near zero, RSI divergence). Trigger: holding $9.00 on pullbacks with RSI staying above 30. Target: $9.50 to $11.00. Invalidation: close below $8.30 or above $12.70. (25% probability)
- Scenario 3: Bullish Oversold Bounce / Reversal — A mean-reversion rally from the lower band, helped by the MACD crossover and CMF flipping positive. Trigger: close above $11.50 to $12.00 (Nov 9 high and upper band). Target: $13.40 to $14.00 (EMA 50 / SMA50D). Invalidation: close back below $9.05. (25% probability)
PRICE TARGETS
- Target Price: $8.40 (62 days, Jan 16, 2027)
- Expected Range: $6.50 to $11.50 (width $5.00, about 52% of current price, wider than the 18-30% guideline for 61-180 days. Self-check: this is a very high-volatility stock with ATR of $0.92, about 9.7% of price per day. The 62-day range is therefore deliberately wide, and I accept it as higher than the guideline because the guideline range of about $6.9 to $12.0 would cover less than one standard deviation of this stock's plausible movement.)
- Key Levels: Support at $8.31, Resistance at $11.50
OVERALL BIAS
OVERALL BIAS: BEARISH - ADX of 41 with −DI (36.1) far above +DI (14.4), price below all key moving averages (EMA 50/200, SMA 50/200, VWAP), a death cross in place and price hugging the lower Bollinger band all favor continuation lower. The shallow MACD crossover and neutral CMF argue only for a possible bounce, which probably faces heavy resistance at $11.50 to $13.40.
This is educational analysis and not financial advice.