QBTS 4-day bearish forecast — Nov 1, 2026
- Bias: Bearish
- Timeframe: 4 days (made Nov 1, 2026, target date Nov 4, 2026)
- Price at analysis: $10.64
- Price target: $10.45
- Expected range: $10.15 – $10.80
- Result: Correct (-2.4%) — closed at $10.39 on Nov 4, 2026; quality score 100/100
Get a free AI analysis of QBTS today
Analysis
TECHNICAL INDICATORS
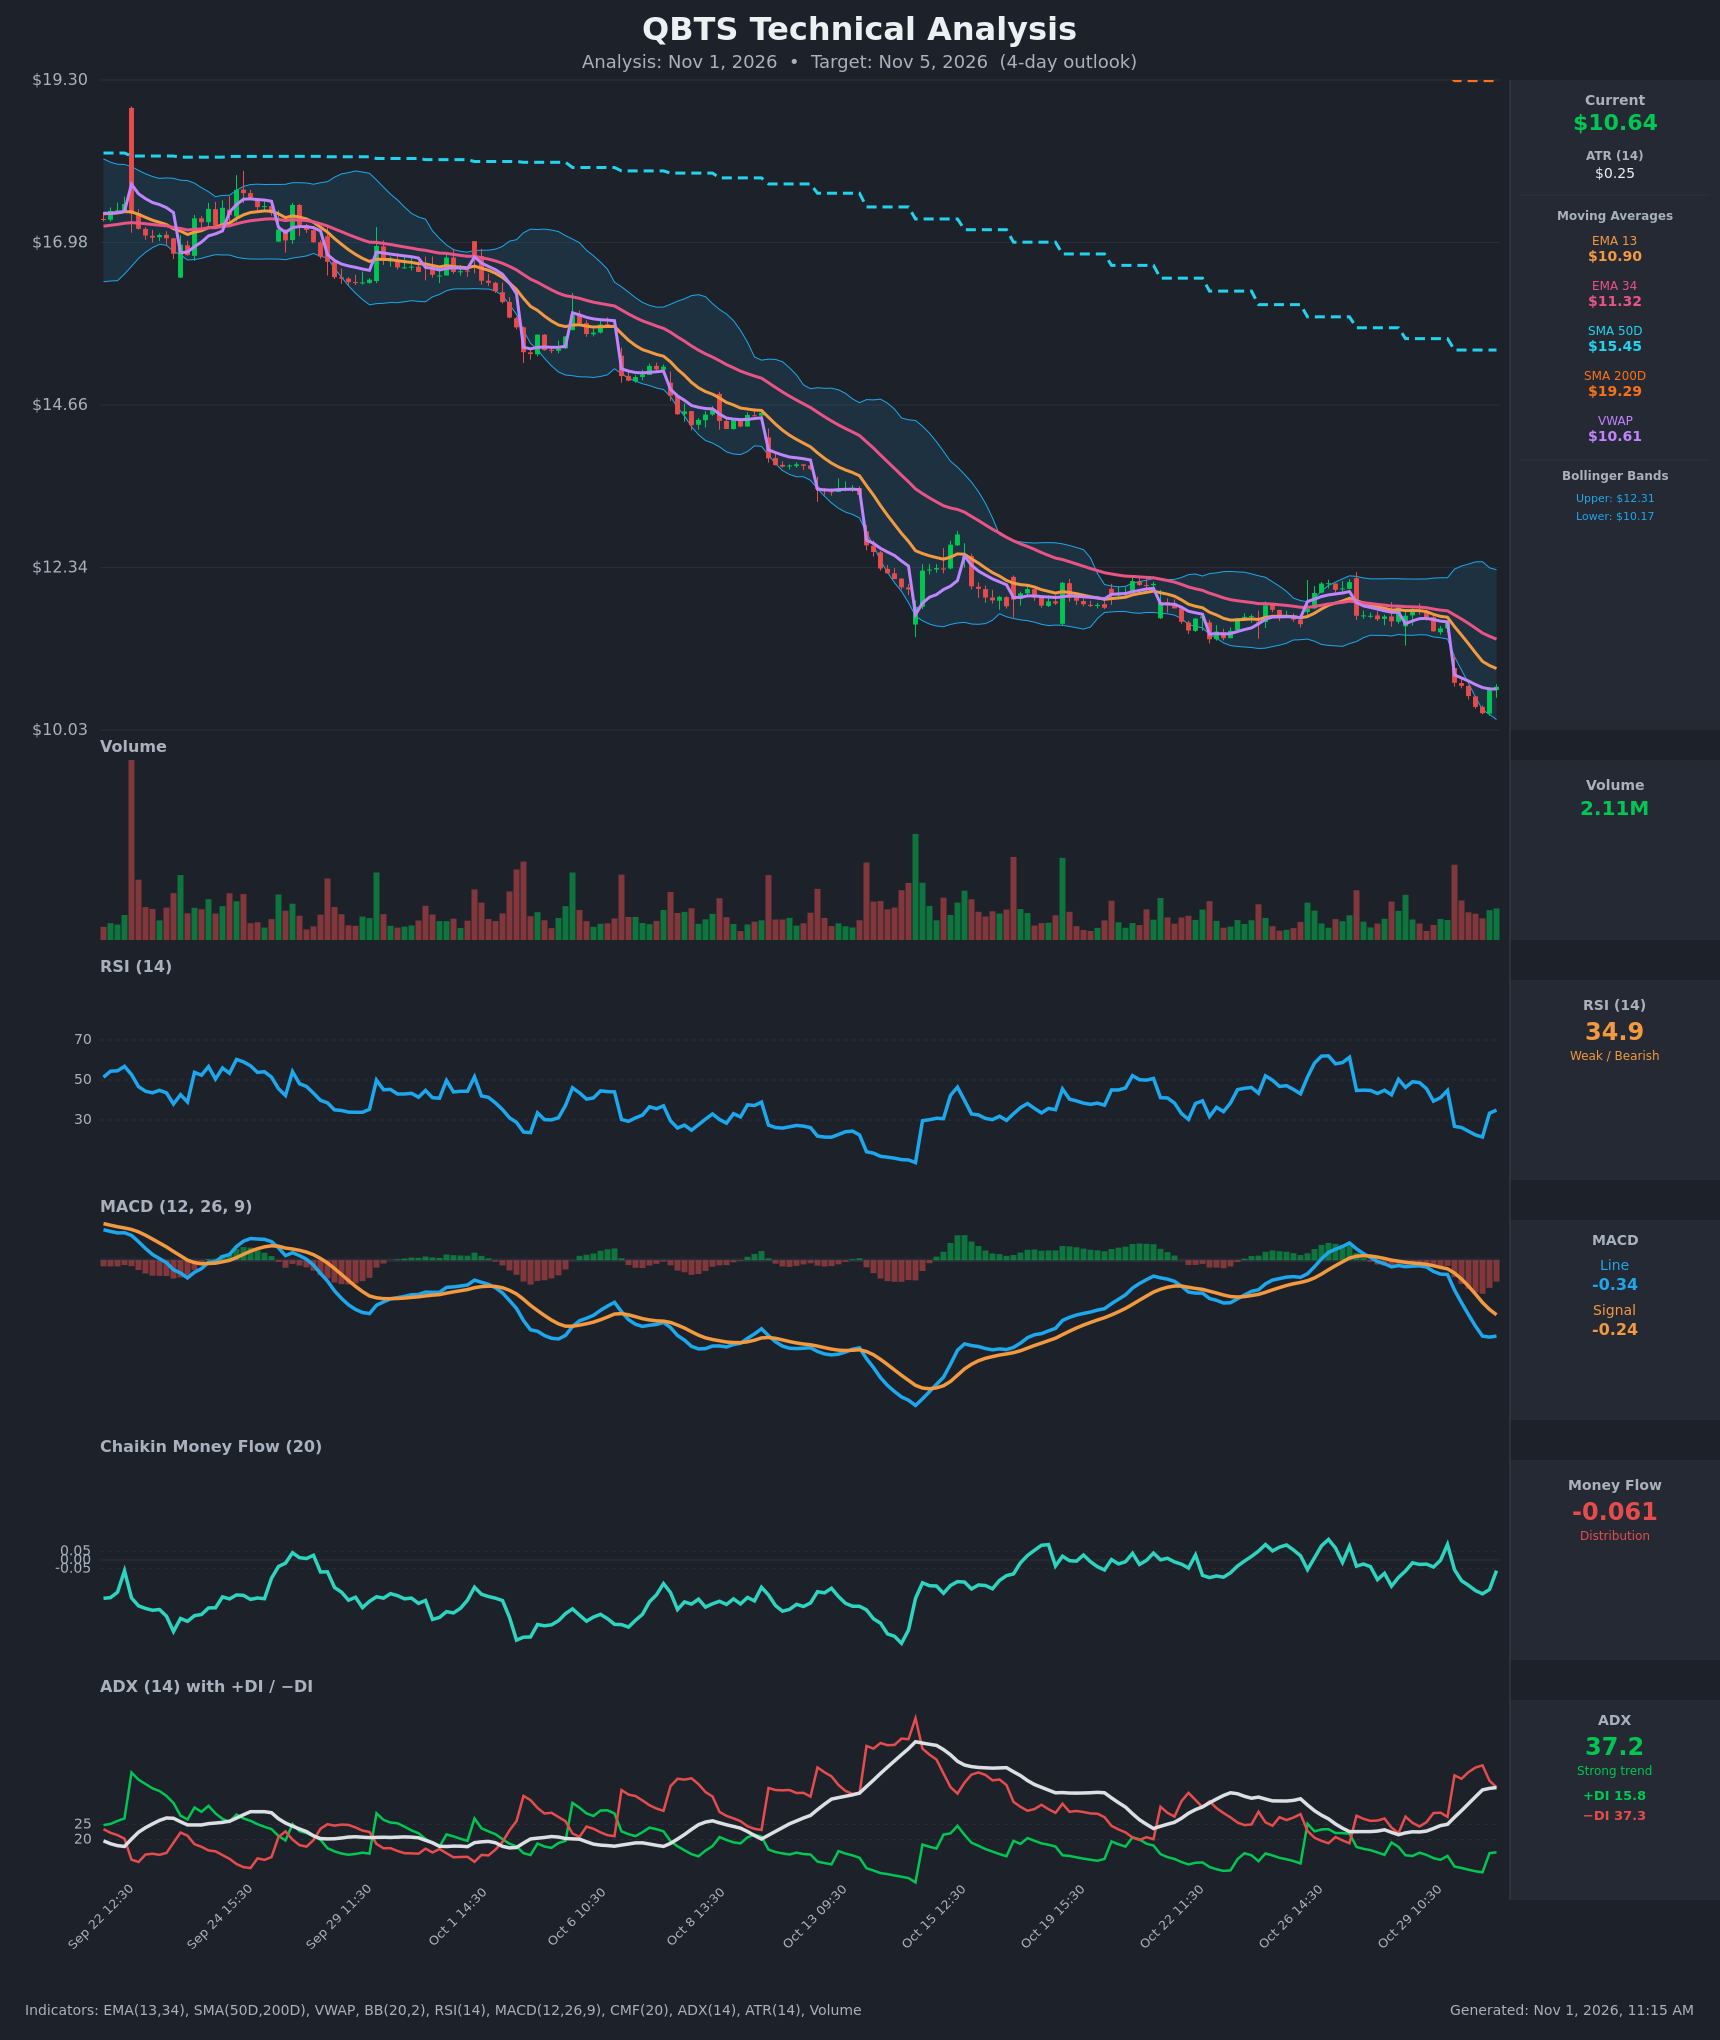
- RSI (14): 34.95. It bounced from a deeply oversold 21.5 at the Oct 30 13:30 low, but it is still below 40 and has not reclaimed 50. Momentum is weak, and the bounce looks corrective so far. [Bearish]
- 20 EMA (EMA 13/34 used): EMA13 is $10.90 and EMA34 is $11.32. Price at $10.64 is below both, and EMA13 is below EMA34 and falling steeply. EMA13 is the first overhead resistance. [Bearish]
- MACD: The line is -0.339 and the signal is -0.243. The line crossed below the signal around Oct 29 and the gap has widened. The line is flat to slightly rising over the last two bars, so downside momentum is stalling but no bullish cross has formed. [Bearish]
- Bollinger Bands (20): Upper is $12.31, lower is $10.17 and the midline is about $11.24. Price is in the lower quarter of the bands (%B ≈ 0.22) after riding or piercing the lower band. A walk down the lower band signals a strong downtrend, but price is also stretched, which raises the odds of a relief bounce toward the midline. [Bearish]
- CMF (20): -0.061 is just below the -0.05 threshold. It has recovered from -0.193 but remains in mild distribution, so sellers still have a slight edge. [Distribution]
- ADX (14): 37.2 and rising, with −DI (37.3) far above +DI (15.8). This is a strong, established downtrend. +DI has ticked up from 9, which shows some bounce attempt but no bullish control. [Strong Trend – Bearish]
- Volume: 2.11M is average, with no capitulation spike. The Oct 30 gap-down session had the heavy volume, and the latest green bar is on modest volume. Price is just above VWAP ($10.61), so the bounce lacks conviction. [Neutral-to-Bearish]
DIVERGENCES & TRENDS
- No bullish divergence yet. RSI made a higher low relative to the price low only because of the sharp bounce, and price has not made a clear new low with a higher RSI.
- Price is below the SMA50 ($15.45) and SMA200 ($19.29). The SMA50 is below the SMA200, a death cross already in place, and both are sloping down.
- EMA13 is below EMA34, with the gap widening from $0.05 to $0.42 over the last 15 bars. This confirms accelerating bearish momentum.
- The Oct 30 gap down from $11.56 to $10.70 broke a multi-week consolidation. The unfilled gap sits far above, near $11.50.
- The DI spread is wide (−DI 37.3 vs +DI 15.8). Price is hugging VWAP ($10.61), which is acting as a pivot.
- Price is far below the lower trend structure of the whole decline from $17+ to $10.6, and sellers have repeatedly won each rally attempt.
CHART PATTERNS
- Bearish Flag / Rectangle breakdown (continuation): From Oct 15 to Oct 29, price consolidated in a roughly $11.4–$12.3 range after the earlier leg down. The Oct 30 gap below the range resolved bearishly, which is consistent with the Bearish Flag/Pennant continuation concept. The measured move extends well below $10, but within 4 days only a partial follow-through is realistic.
- Staircase downtrend (lower highs and lower lows): Price has made a series of descending consolidations and breakdowns since late September.
- Possible short-term base: The last two bars form a small hammer-like bounce off $10.2. This is not a confirmed reversal pattern, and a Double Bottom would need a retest of the low and a break above about $10.90–$11.00.
POTENTIAL SCENARIOS
- Scenario 1: Bearish Trend Continuation — The bounce stalls at the EMA13/VWAP zone and sellers resume control, with −DI dominant and MACD below its signal. Trigger: rejection at $10.90 or a hourly close below VWAP ($10.61) and then $10.40. Target: $10.20–$10.45, with a possible probe of the lower band near $10.17. Invalidation: a sustained close above $11.00. (50% probability)
- Scenario 2: Bullish Oversold Relief Bounce — RSI reset from 21 and price near the lower band trigger short covering, and price reclaims EMA13. Trigger: a close above $10.90 on rising volume with the MACD line curling up. Target: $11.20–$11.30 (EMA34 and the Bollinger midline). Invalidation: a break back below $10.40. (32% probability)
- Scenario 3: Neutral Basing Chop — Price oscillates around VWAP between the lower band and EMA13 while indicators cool. Trigger: failure to break either $10.20 or $10.90. Target: $10.45–$10.80. Invalidation: a decisive break of either boundary. (18% probability)
PRICE TARGETS
For the 4-day horizon (Nov 5), with a bearish bias, a target near $10.45 sits slightly below the current price. The ATR of $0.25 supports a typical swing of about $0.25–$0.50 over the horizon.
- Target Price: $10.45
- Expected Range: $10.15 to $10.80 (width $0.65 ≈ 6.1% of current price, slightly above the 2-3 day guide because the trend is strong and ATR is elevated)
- Key Levels: Support at $10.17, Resistance at $10.90
OVERALL BIAS
OVERALL BIAS: BEARISH - Price is below every moving average, with −DI far above +DI at ADX 37, MACD below its signal and CMF in mild distribution. The breakdown from the consolidation points to continuation, though the oversold RSI and the position near the lower band make a relief bounce a real risk, so conviction is modest.
This is educational analysis and not financial advice.