IBIT 4-day bearish forecast — Nov 1, 2026
- Bias: Bearish
- Timeframe: 4 days (made Nov 1, 2026, target date Nov 4, 2026)
- Price at analysis: $43.35
- Price target: $42.90
- Expected range: $41.95 – $44.30
- Result: Incorrect (+5.4%) — closed at $45.71 on Nov 4, 2026; quality score 0/100
Get a free AI analysis of IBIT today
Analysis
TECHNICAL INDICATORS
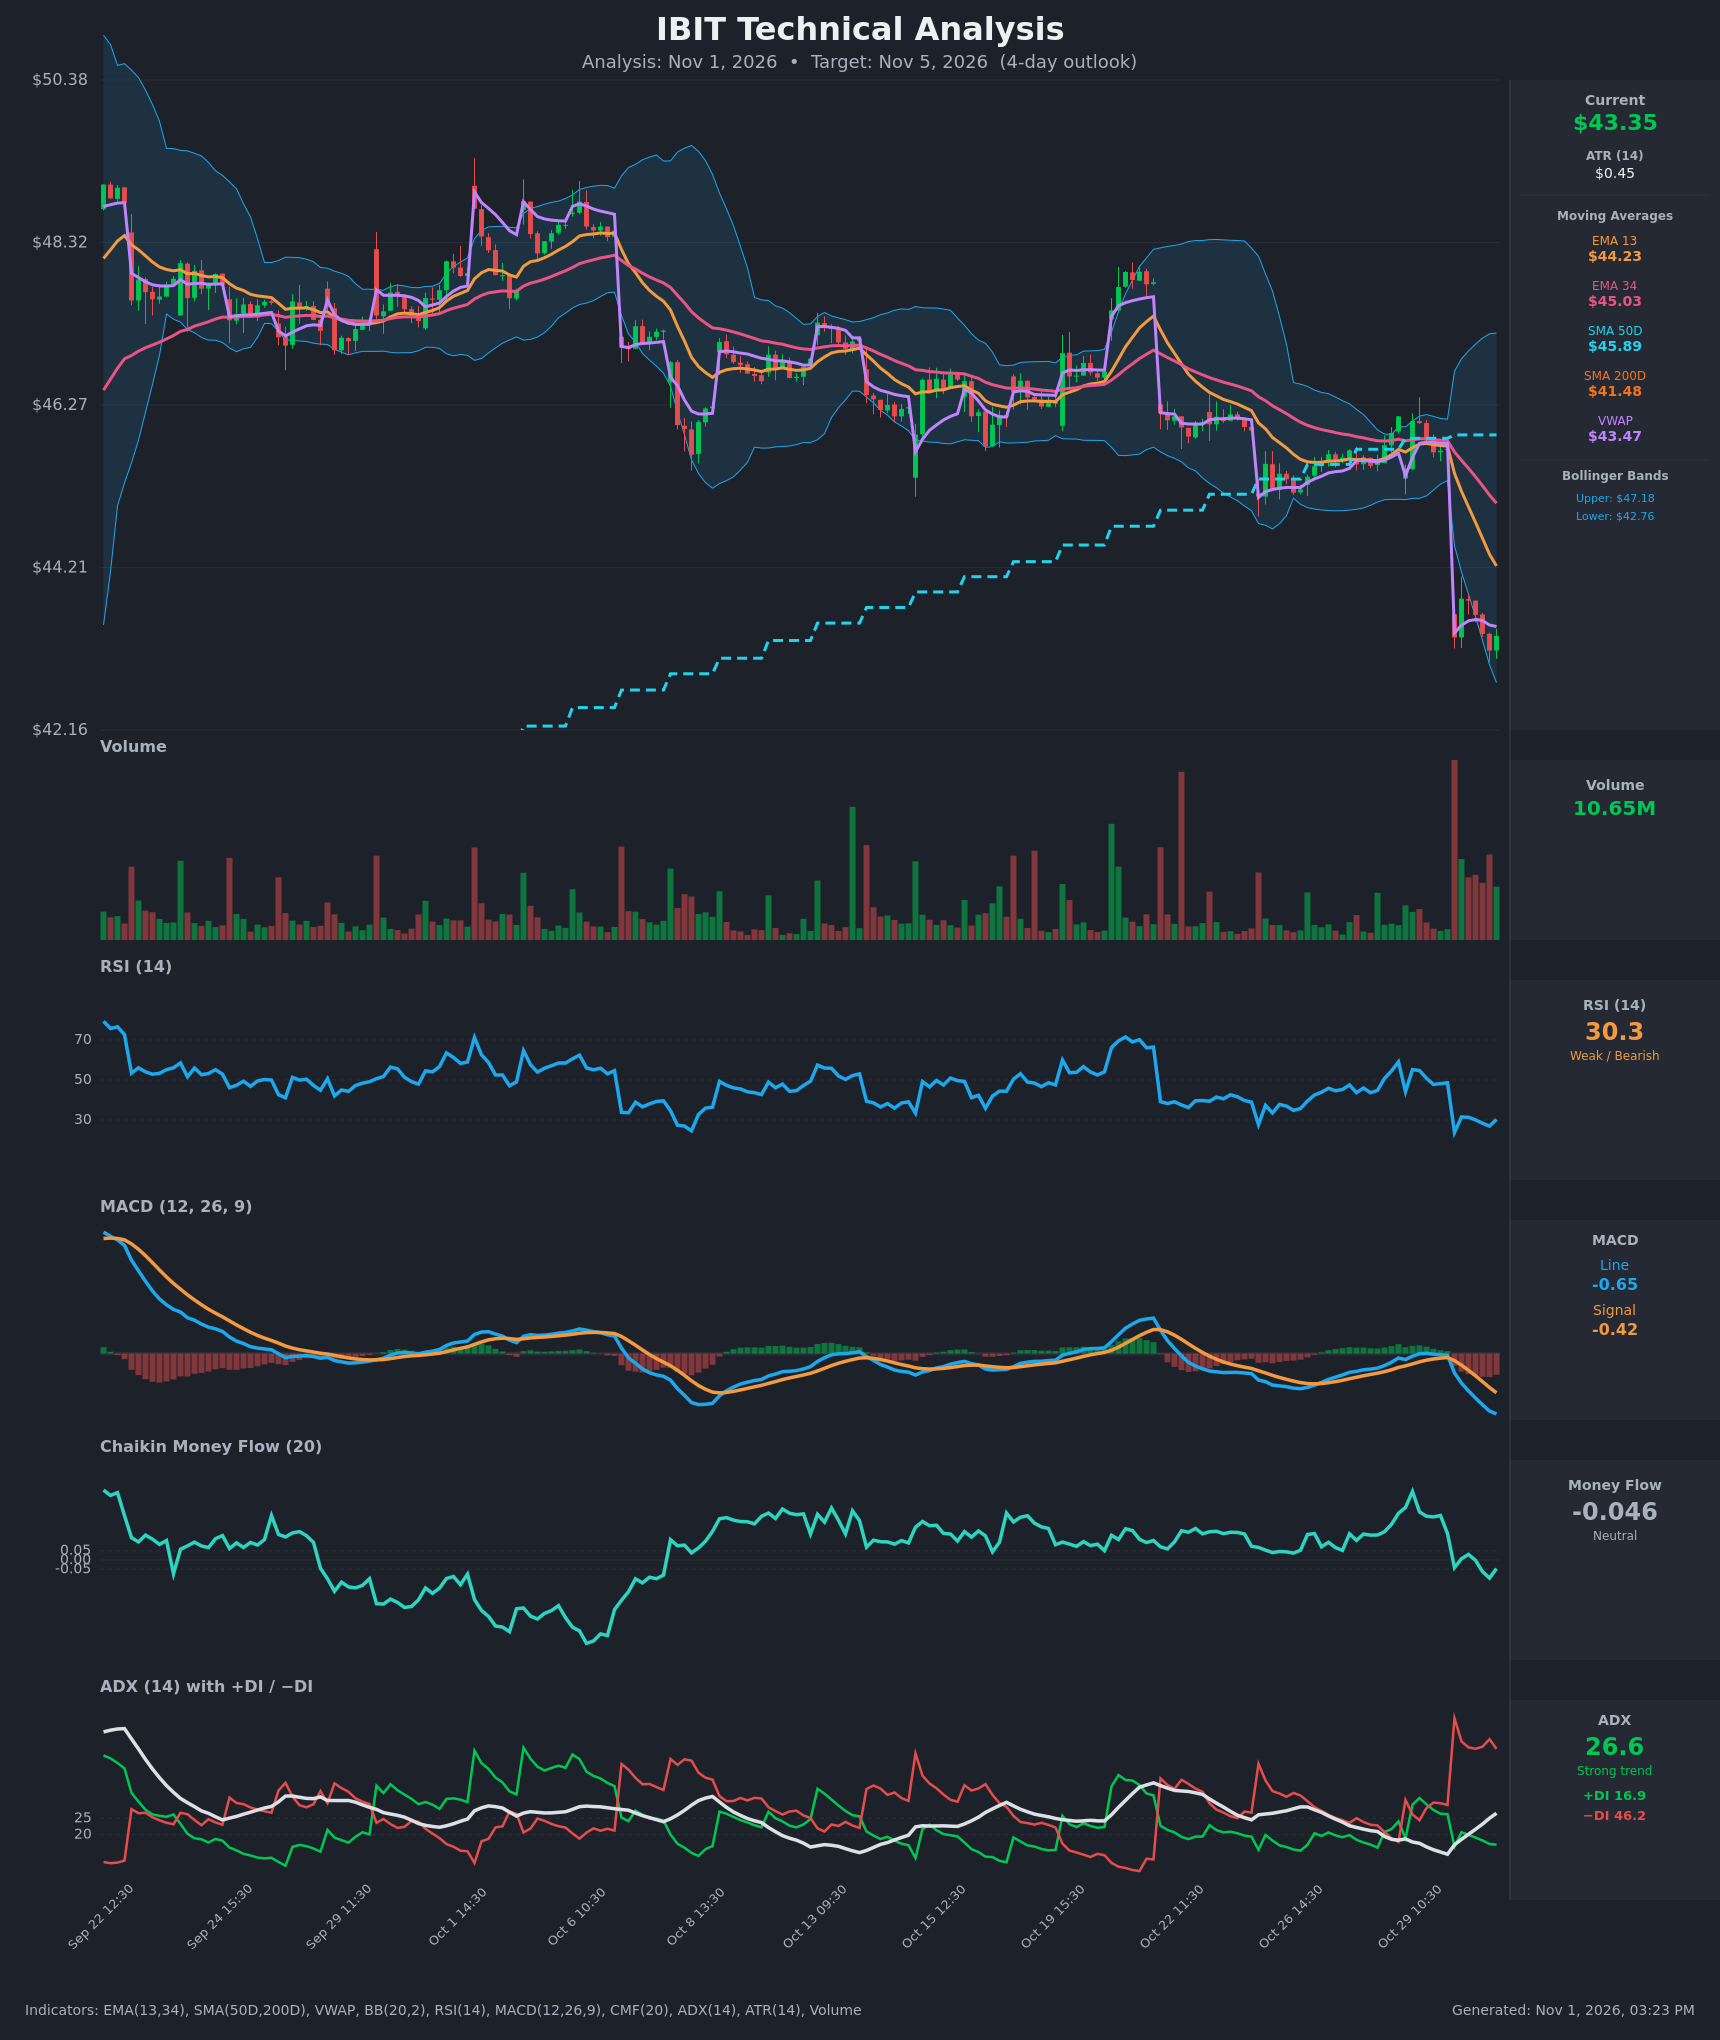
- RSI (14): 30.27, right at the oversold threshold. It plunged from about 48 to 23.8 on the Oct 30 gap, bounced to 31.5, and has stayed pinned in the 27-31 zone with no real recovery. Momentum is weak, though an oversold bounce is possible. [Bearish]
- 20 EMA: The data gives EMA13 at $44.23 and EMA34 at $45.03. Price at $43.35 is below both, and both are sloping sharply down. EMA13 is below EMA34 and the gap is widening. The 13 EMA is the first overhead resistance, about $0.88 above price. [Bearish]
- MACD: Line -0.648 is below Signal -0.421, a bearish crossover that occurred on Oct 30 and has widened every bar since. The histogram is negative and expanding, so downside momentum is still building. [Bearish]
- Bollinger Bands (20): Upper $47.18, lower $42.76. Price is near the lower band (about 0.6 below it), and the bands have expanded sharply after the gap. Price is riding the lower half, which is a bearish trend signal. It is also stretched enough that a bounce toward the mid-band is possible. [Bearish]
- CMF (20): -0.046, just inside the neutral zone (±0.05) after falling from +0.25 to +0.37 before the gap. It has flipped from strong accumulation to mild distribution and sits right on the edge of the distribution threshold. [Neutral]
- ADX (14): 26.6 and rising, above the 25 trend threshold. −DI at 46.2 is far above +DI at 16.9, so bears are firmly in control. A strong, developing downtrend is in place. [Strong Trend – Bearish]
- Volume: 10.65M. The gap-down session had the highest volume on the chart, which confirms the breakdown with conviction. Subsequent bars carry above-average volume but are fading slightly. Selling was heavy, and no clear capitulation reversal has appeared. [Bearish – confirms breakdown]
DIVERGENCES & TRENDS
- No bullish RSI or MACD divergence is visible. RSI is making roughly equal lows (23.8 → 27.0) while price also made a lower low at $43.16, so there is no clear divergence. MACD is making fresh lows.
- EMA13 crossed below EMA34 earlier, and the spread is widening. The SMA50D ($45.89) is well above price and rising only slowly. The SMA200D ($41.48) is rising and sits about 4.3% below price. There is no death cross, since SMA50D remains above SMA200D.
- Price is below VWAP ($43.47) by a small margin, and the gap-day VWAP anchor is acting as nearby resistance.
- The MACD bearish crossover has widened, and −DI has stayed above +DI since Oct 30, a persistent bearish trend.
- The prior $45-$48 multi-week range broke down on the gap. The old range floor (~$45.5) is now overhead supply.
CHART PATTERNS
- Range breakdown with gap: Price left a multi-week consolidation (~$45.5-$48) with a gap down to ~$43.3. This is a bearish continuation and breakdown structure.
- Bearish flag/pennant (tentative): After the gap, price bounced to $43.82 and drifted back to $43.16-$43.35 in a small lower-high sequence. This resembles the diagram's Bearish Flag/Pennant. A break below ~$43.16 would suggest a continuation measured by the flagpole, though the whole move is only about 4 days out, so only partial progress toward the target is likely.
- The reaction low at $43.16 and the lower Bollinger Band at ~$42.76 are the nearest downside targets. The SMA200D at $41.48 is the major support if the move extends.
POTENTIAL SCENARIOS
- Scenario 1: Bearish Flag Continuation — Price fails below VWAP and the 13 EMA, breaks the $43.16 low, and tests the lower Bollinger Band. Trigger: close below $43.16 on solid volume. Target: $42.40-$42.76 (lower BB), with an extension toward $42.00. Invalidation: a close above $44.25 (EMA13). (50% probability)
- Scenario 2: Bullish Oversold Bounce — RSI around 30 triggers a relief rally back toward the falling EMA13 and the gap zone. Trigger: reclaim of VWAP/$43.80 on a rising-volume green bar. Target: $44.20-$44.50. Invalidation: a lower low below $43.10. (30% probability)
- Scenario 3: Neutral Basing — Price chops between $42.76 and $43.85 as the selling exhausts. Trigger: failed breakdown with low volume. Target: $43.20-$43.60. Invalidation: close outside the $42.60-$44.30 band. (20% probability)
PRICE TARGETS
For a 4-day horizon, with ATR $0.45 giving a typical 4-day move of about ±$0.9 to $1.2, the range width is 5.4% of current price. This is in line with the 4-day guidance (a little over the 2-3 day band, scaled up).
- Target Price: $42.90 (below current price of $43.35)
- Expected Range: $41.95 to $44.30 (width $2.35, about 5.4%)
- Key Levels: Support at $42.76, Resistance at $44.23
OVERALL BIAS
OVERALL BIAS: BEARISH - ADX is 26.6 and rising with −DI (46.2) far above +DI (16.9), MACD is below its signal with an expanding negative histogram, and price is below all key EMAs and VWAP after a high-volume gap breakdown. The oversold RSI (~30) caps conviction and raises bounce risk, so the downside is likely modest, toward the lower Bollinger Band.
This is educational analysis and not financial advice.