IBIT 34-day bearish forecast — Nov 15, 2026
- Bias: Bearish
- Timeframe: 34 days (made Nov 15, 2026, target date Dec 18, 2026)
- Price at analysis: $38.94
- Price target: $36.80
- Expected range: $33.50 – $39.50
- Result: Pending — graded after the close on Dec 18, 2026
Get a free AI analysis of IBIT today
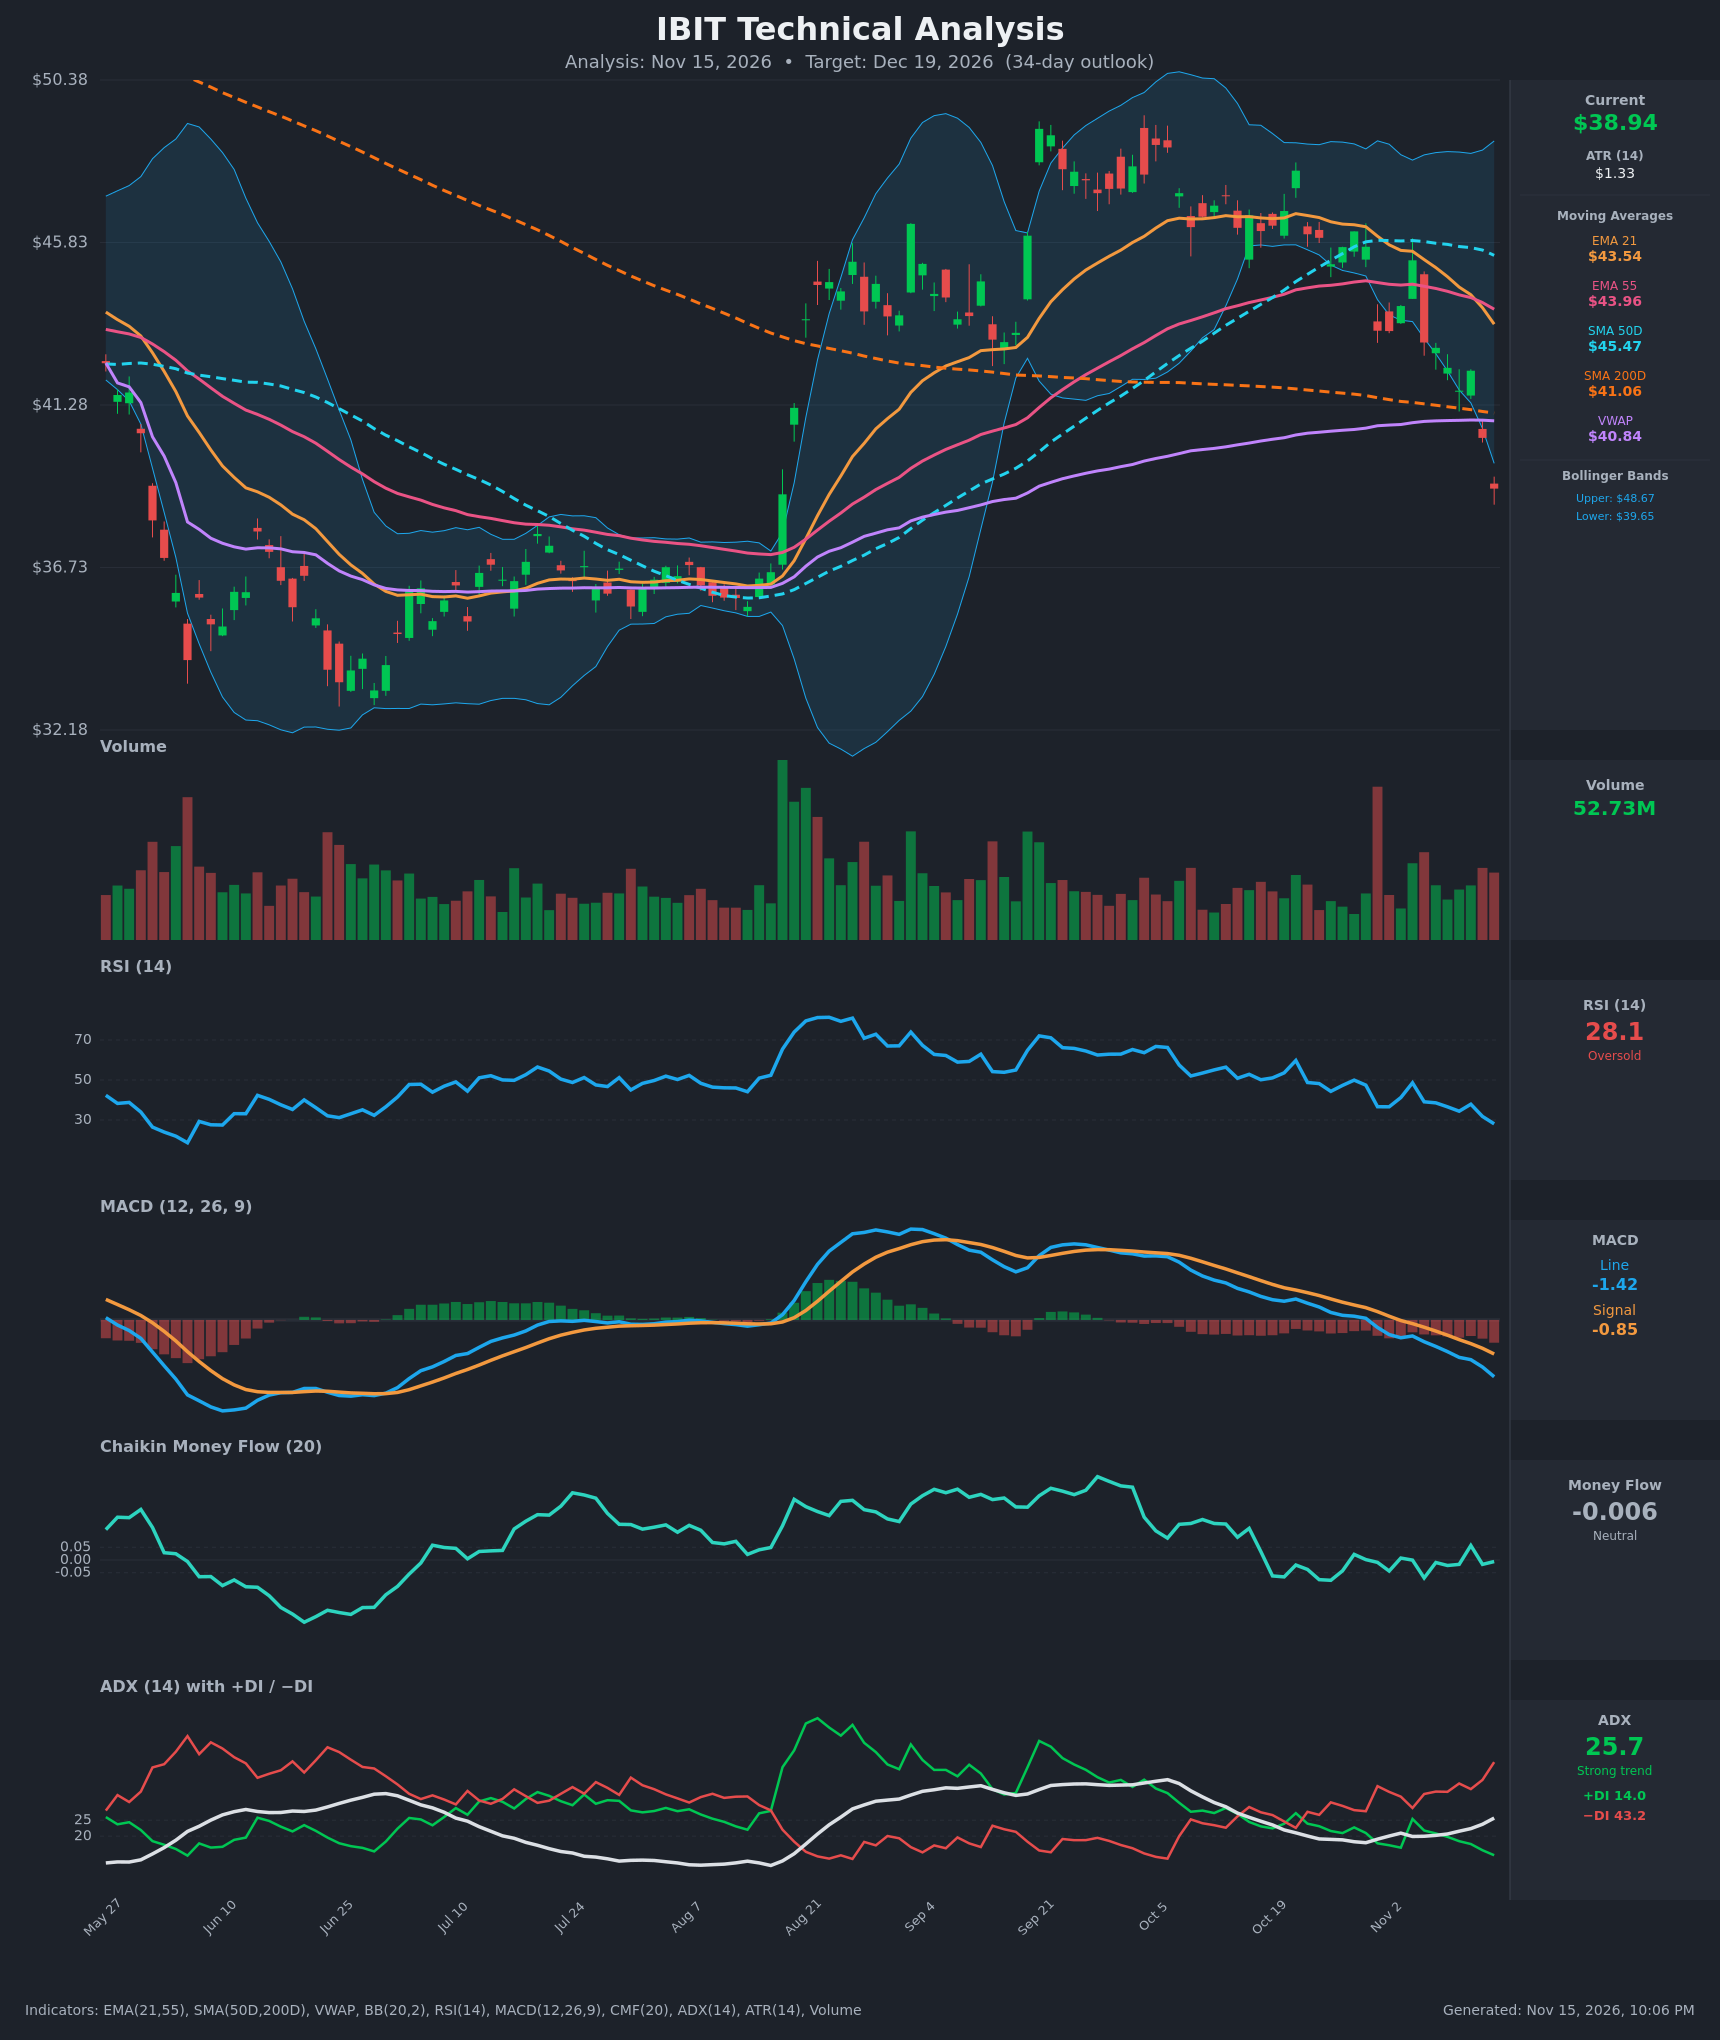
Analysis
TECHNICAL INDICATORS
- RSI (14): 28.08, in oversold territory and down from 48.6 on Nov 4. Momentum is still falling, with no bullish divergence yet. Oversold readings in a strong downtrend often stay oversold, though a relief bounce is increasingly likely. [Bearish]
- 20 EMA (EMA 21): $43.54, with price at $38.94 about 10.6% below it. EMA21 crossed below EMA55 ($43.96) on Nov 12 ($44.00 vs $44.15), a bearish crossover. The EMAs now act as overhead resistance. [Bearish]
- MACD: Line -1.42 is below signal -0.85 and the gap is widening. The bearish crossover came around Nov 3, and the histogram has been negative and expanding since. [Bearish]
- Bollinger Bands (20): Upper $48.67, lower $39.65. Price at $38.94 closed below the lower band after a sharp band expansion, which signals strong downside momentum. It can also mean short-term exhaustion and a snap-back toward the mid-band, but the mid-band sits far above near $44. [Bearish]
- CMF (20): -0.006, between ±0.05, so neutral. It has hovered around zero through the decline, so there is no accumulation to support a reversal. Distribution is not aggressive either. [Neutral]
- ADX (14): 25.7 and rising from about 19 on Oct 30, so a strong trend is emerging. −DI at 43.2 is far above +DI at 14.0, so bears are firmly in control. [Strong Trend – Bearish]
- Volume: 52.73M, elevated relative to recent sessions, with heavy volume on the red breakdown candles (Oct 30 spike). Selling on expanding volume confirms the downtrend and shows no capitulation exhaustion yet. [Bearish confirmation]
DIVERGENCES & TRENDS
- No bullish RSI or MACD divergence yet. Price made a new swing low at $38.94 and RSI fell to 28.1 in step, so momentum confirms price.
- Price is below EMA21, EMA55 and SMA50D ($45.47). It is also below the SMA200D ($41.06) and VWAP ($40.84), a loss of the key long-term support and the volume-weighted average.
- EMA21 crossed below EMA55 on Nov 12, and MACD crossed below its signal in early November. Both are confirmed bearish crosses.
- SMA50D ($45.47) is rolling over toward SMA200D ($41.06). A death cross is not yet in place but is possible if weakness persists.
- −DI has surged from about 29 to 43 while +DI has collapsed to 14, with ADX turning up through 25. This is a classic bearish trend-acceleration setup.
- The bounce that failed at $45.33 on Nov 4 produced a lower high, and the series of lower highs and lower lows is intact.
CHART PATTERNS
- Bearish Double/Triple Top (reversal): The September–October highs near $47–48 formed repeated failures at resistance. The breakdown through the ~$43–44 neckline area was confirmed by the move to $38.94. The measured move (about $5 from the top to the neckline) projects to roughly $38–39, so the target has largely been met. Further downside needs a new leg.
- Prior base: The May–August consolidation at $35–37 is the next major structural support. A retest of that base is the logical extension of the move.
- No clean bullish reversal pattern, such as a double bottom or falling wedge, has formed yet. The oversold RSI and the stretch below the lower band suggest a possible relief bounce toward the $40.8–41.1 resistance cluster (VWAP and SMA200D).
POTENTIAL SCENARIOS
- Scenario 1: Bearish Trend Continuation to Prior Base — The −DI dominance and rising ADX favor a continued grind lower toward the $35–37 consolidation zone, perhaps after a brief relief bounce that fails below the SMA200D/VWAP. Trigger: a close below $38.00 or a rejection near $40.80–41.06. Target: $36.80, with an extension to $34.50–35.00. Invalidation: a daily close above $41.10 (SMA200D) with MACD histogram turning up. (55% probability)
- Scenario 2: Bullish Oversold Relief Rally — RSI at 28 and price below the lower Bollinger Band set up a mean-reversion bounce, with the SMA200D and VWAP as magnets. Trigger: a reclaim of $39.65 (lower band) on rising volume. Target: $40.80–41.50, with a possible stretch to $43.50 (EMA21). Invalidation: failure to hold $38.00 or a new low below $37.50. (33% probability)
- Scenario 3: Neutral Base Building — Price stabilizes with CMF near zero and chops between $37 and $40.50 as selling momentum fades. Trigger: ADX rolling over below 25 and RSI holding above 30. Target: $38.50–39.50. Invalidation: a close outside the $36.50–$41.00 range. (12% probability)
PRICE TARGETS
For the 34-day horizon (to Dec 19, 2026):
- Target Price: $36.80
- Expected Range: $33.50 to $39.50 (a $6.00 width, about 15.4% of the current price, in line with the 30–60 day guidance)
- Key Levels: Support at $36.70, Resistance at $41.00
OVERALL BIAS
OVERALL BIAS: BEARISH - Price is below the lower Bollinger Band and the SMA200D, with a bearish EMA21/EMA55 cross, a widening negative MACD gap and a dominant −DI (43.2 vs 14.0) with ADX rising above 25. Oversold RSI raises the odds of a bounce, but the VWAP/SMA200D cluster near $41 should cap it, leaving a drift toward the $35–37 base as the more likely path.
This is educational analysis and not financial advice.