IBIT 20-day bearish forecast — Nov 15, 2026
- Bias: Bearish
- Timeframe: 20 days (made Nov 15, 2026, target date Dec 4, 2026)
- Price at analysis: $38.94
- Price target: $37.90
- Expected range: $35.50 – $40.60
- Result: Pending — graded after the close on Dec 4, 2026
Get a free AI analysis of IBIT today
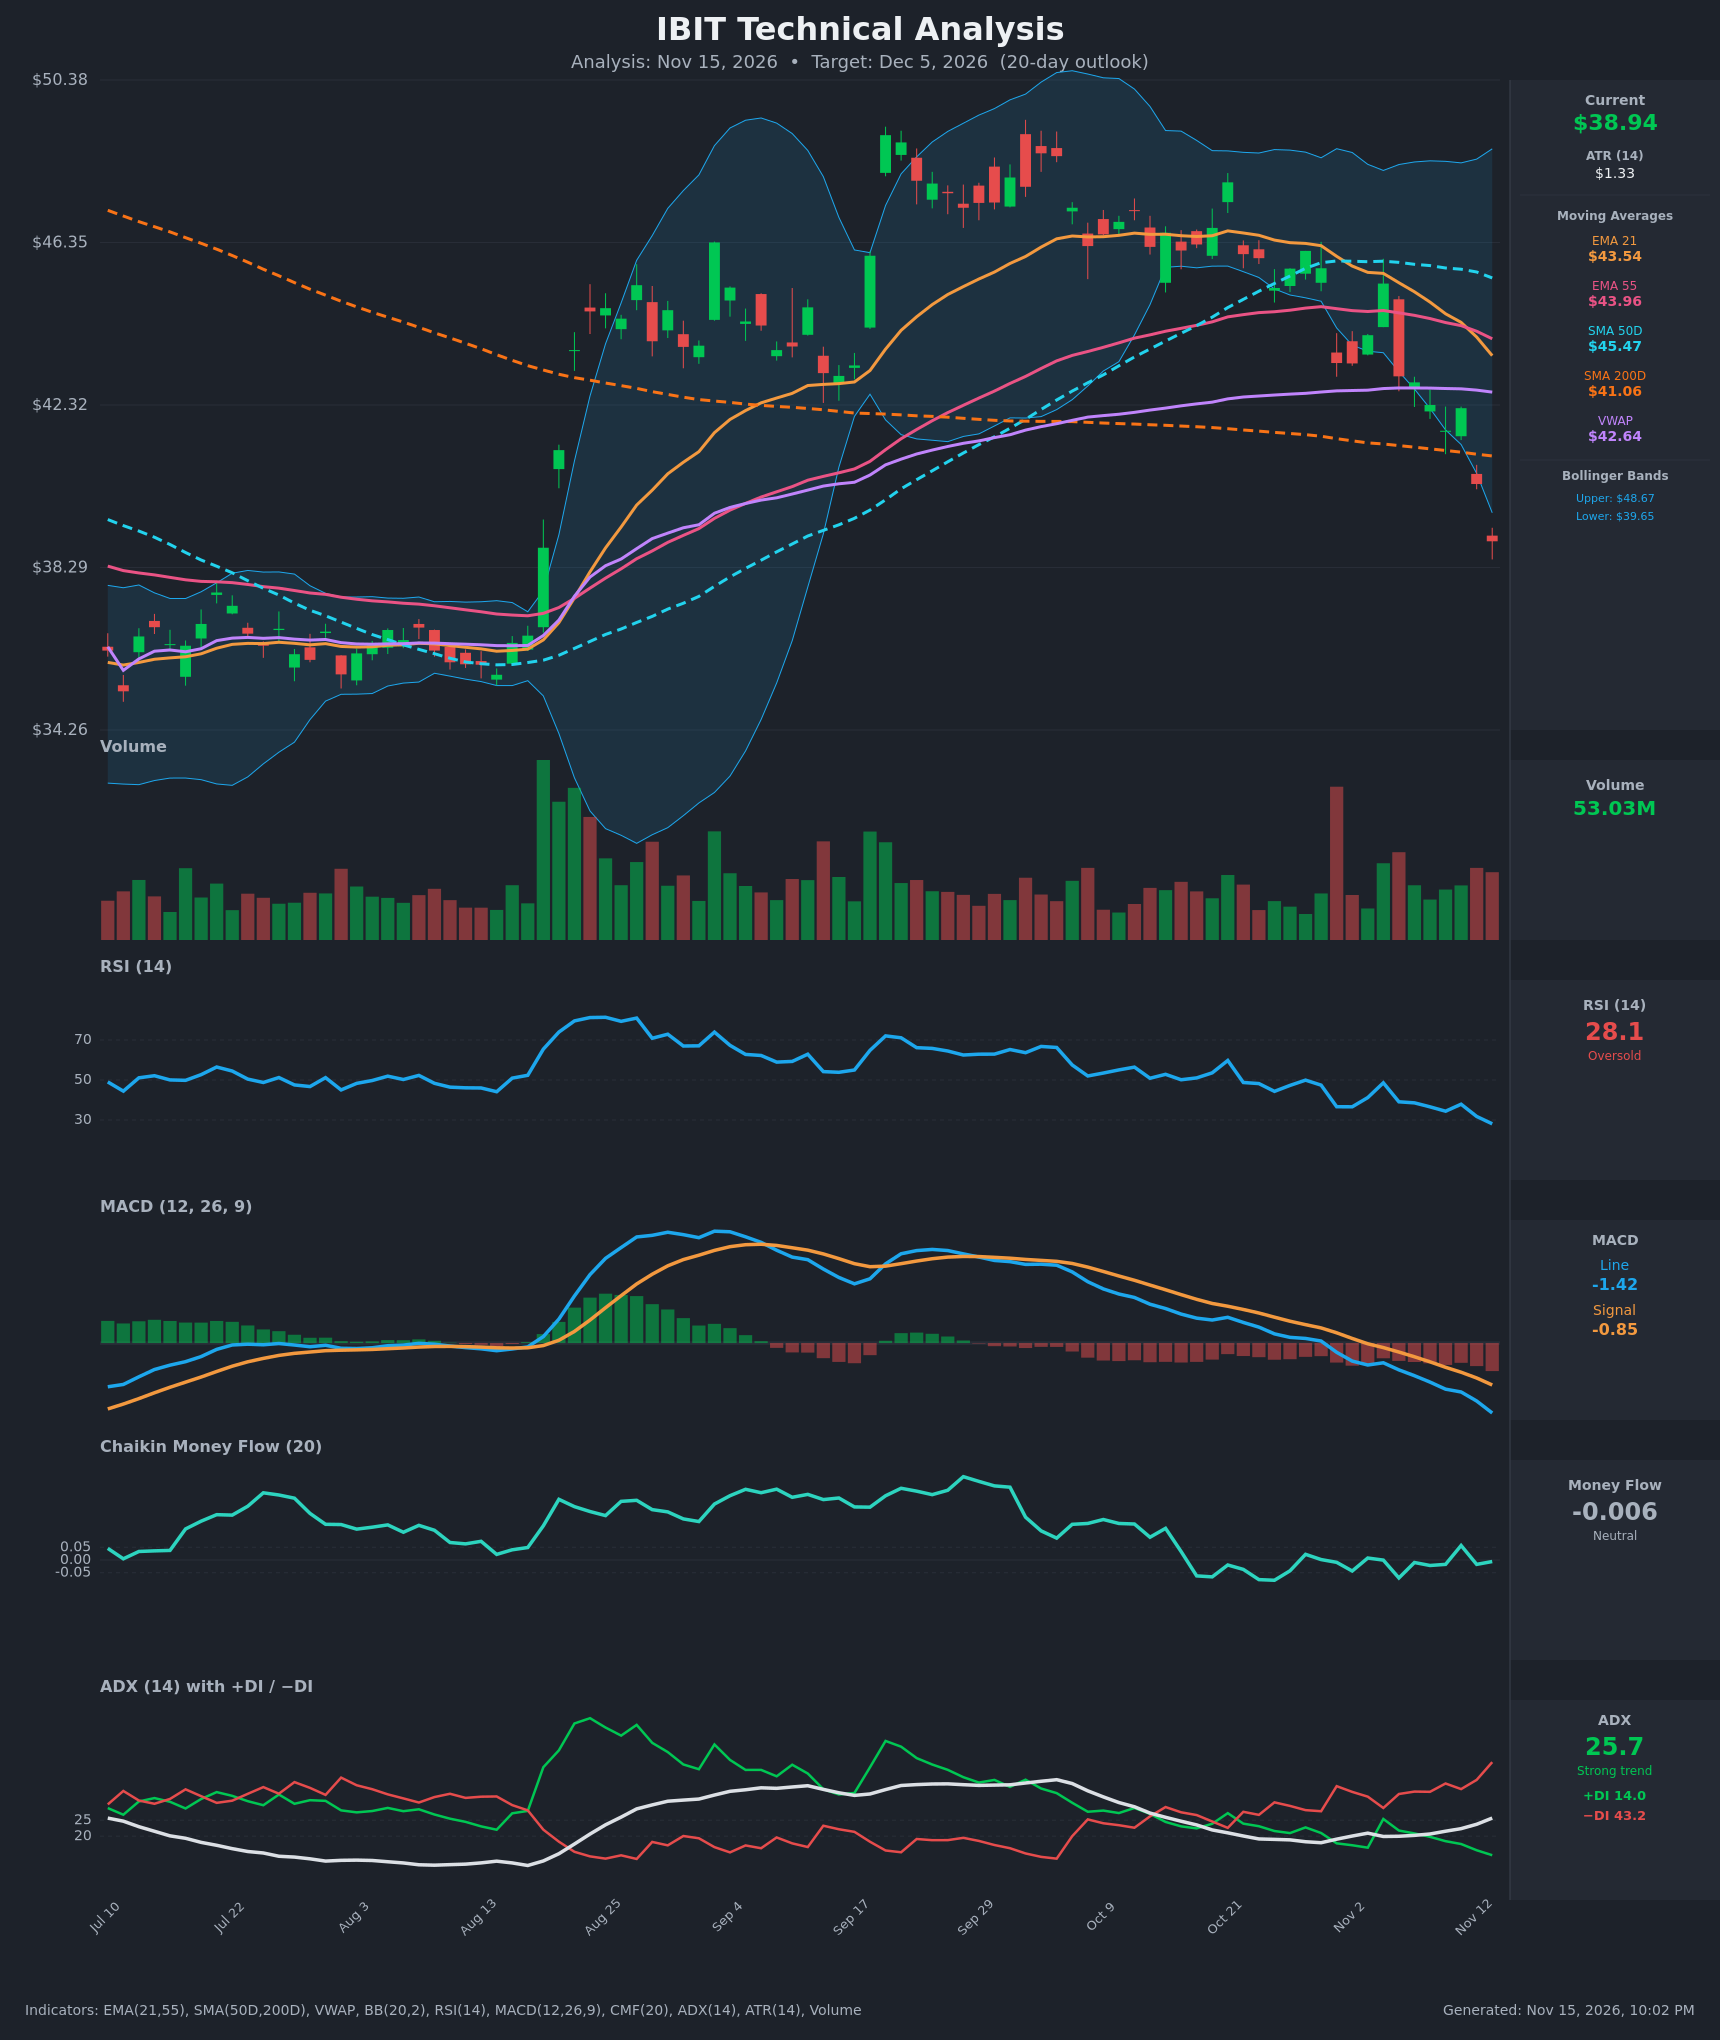
Analysis
TECHNICAL INDICATORS
- RSI (14): 28.08, in oversold territory (<30) and falling steadily from 48.6 on Nov 4. Momentum is clearly bearish, but the reading is stretched and raises the odds of a relief bounce. [Bearish]
- 20 EMA: The 21 EMA is at $43.54, and price at $38.94 is about 10.6% below it. EMA21 has crossed below EMA55 ($43.96), so the short-term average is now resistance and slopes down. [Bearish]
- MACD: Line at -1.42 is below signal at -0.85, with a bearish crossover on Nov 3. The histogram is negative and widening, so downside momentum is still accelerating. [Bearish]
- Bollinger Bands (20): Price at $38.94 is below the lower band ($39.65) after a series of closes riding or breaking it. The bands are wide after the Aug–Oct expansion. This is a stretched move that can mean-revert, but a band walk in a trend is also common. [Bearish]
- CMF (20): -0.006, inside the neutral band (±0.05). It has hovered around zero and not confirmed heavy distribution, so selling is not backed by strong flow. [Neutral]
- ADX (14): 25.7 and rising from 19 on Oct 30, so a strong trend is emerging. −DI (43.2) is far above +DI (14.0), so sellers are firmly in control. [Strong Trend – Bearish]
- Volume: 53.03M, elevated relative to recent averages, on a down-trending bar breaking to new lows. That suggests committed selling, though a volume spike near the lows could also point to capitulation. [Bearish with possible capitulation]
DIVERGENCES & TRENDS
- There is no bullish RSI divergence yet. RSI and price are making lower lows together, and RSI at 28 is confirming the price low.
- MACD is accelerating lower, with the line well below signal and zero. There is no sign of a momentum bottom.
- EMA21 crossed below EMA55 around Nov 12 (bearish). Price is below EMA21, EMA55, SMA50D ($45.47), VWAP ($42.64) and, as of the last bar, SMA200D ($41.06). Losing the 200-day is a significant trend break.
- SMA50D remains above SMA200D, so there is no death cross yet. It is flattening and rolling over, and one may form later if weakness persists.
- DI spread has widened sharply (−DI 43 vs +DI 14), with ADX turning up. This is a classic early-trend-strength signal for the downside.
- CMF flat near zero is a mild divergence: price is dropping faster than money flow is deteriorating.
CHART PATTERNS
- From the reference diagram, the recent structure resembles a Bearish Head and Shoulders / Double Top reversal. The September–October highs ($46–$48) failed, and price broke the neckline area around $42–$43 and the $41 SMA200D.
- The sequence of lower highs since late September and the break below the support zone fit a bearish reversal. A measured move from the ~$47 top to the ~$42 neckline (~$5) projects to roughly $37, near the current price, so much of the pattern target is already reached.
- A Bearish Flag/Pennant is not clearly present. Price is in a steep, near-vertical drop with no consolidation.
- The prior base around $35–$38 (July–August) is the next major support zone and a possible landing area, similar to a bullish reversal zone if buyers step in.
POTENTIAL SCENARIOS
- Scenario 1: Bearish Trend Continuation — Price stays below the falling EMAs with −DI dominant and MACD still widening. Sellers push toward the prior base. Trigger: failure to reclaim $39.65–$40.50 (lower band/SMA200D area) and a daily close below $38.00. Target: $35.50–$36.50. Invalidation: daily close above $42.60 (VWAP). (45% probability)
- Scenario 2: Bearish-to-Neutral Oversold Bounce, Then Fade — RSI near 28 and price below the lower band trigger a mean-reversion bounce toward the SMA200D/lower band, which then fails below the EMAs. Trigger: bullish candle with RSI turning up above 30. Target: bounce to $40.50–$41.50, then roll over to the high $30s by the end of the window. Invalidation: close above $43.50 (EMA21). (35% probability)
- Scenario 3: Bullish Reversal — Capitulation volume marks a low and price recovers back into the former range. Trigger: reclaim of $41 (SMA200D) with RSI above 40 and MACD histogram shrinking. Target: $43.00–$43.50. Invalidation: new low below $37.50. (20% probability)
PRICE TARGETS
For the 20-day horizon (to about Dec 5), the range width needs to be about 8–12% of the current price, so roughly $3.10 to $4.70.
- Target Price: $37.90
- Expected Range: $35.50 to $40.60 (width $5.10, about 13% of price; slightly wide to reflect the elevated ATR of $1.33 and two-way oversold risk)
- Key Levels: Support at $36.50, Resistance at $41.06
OVERALL BIAS
OVERALL BIAS: BEARISH - Price is below every major moving average, MACD is widening negative, and ADX is rising with −DI far above +DI, which together point to a strong downtrend. The oversold RSI and the lower-band break argue for a bounce along the way, but the path of least resistance leans lower toward the $36–$37 area.
This is educational analysis and not financial advice.