IBIT 48-day bearish forecast — Nov 15, 2026
- Bias: Bearish
- Timeframe: 48 days (made Nov 15, 2026, target date Jan 1, 2027)
- Price at analysis: $38.94
- Price target: $37.00
- Expected range: $34.00 – $40.80
- Result: Pending — graded after the close on Jan 1, 2027
Get a free AI analysis of IBIT today
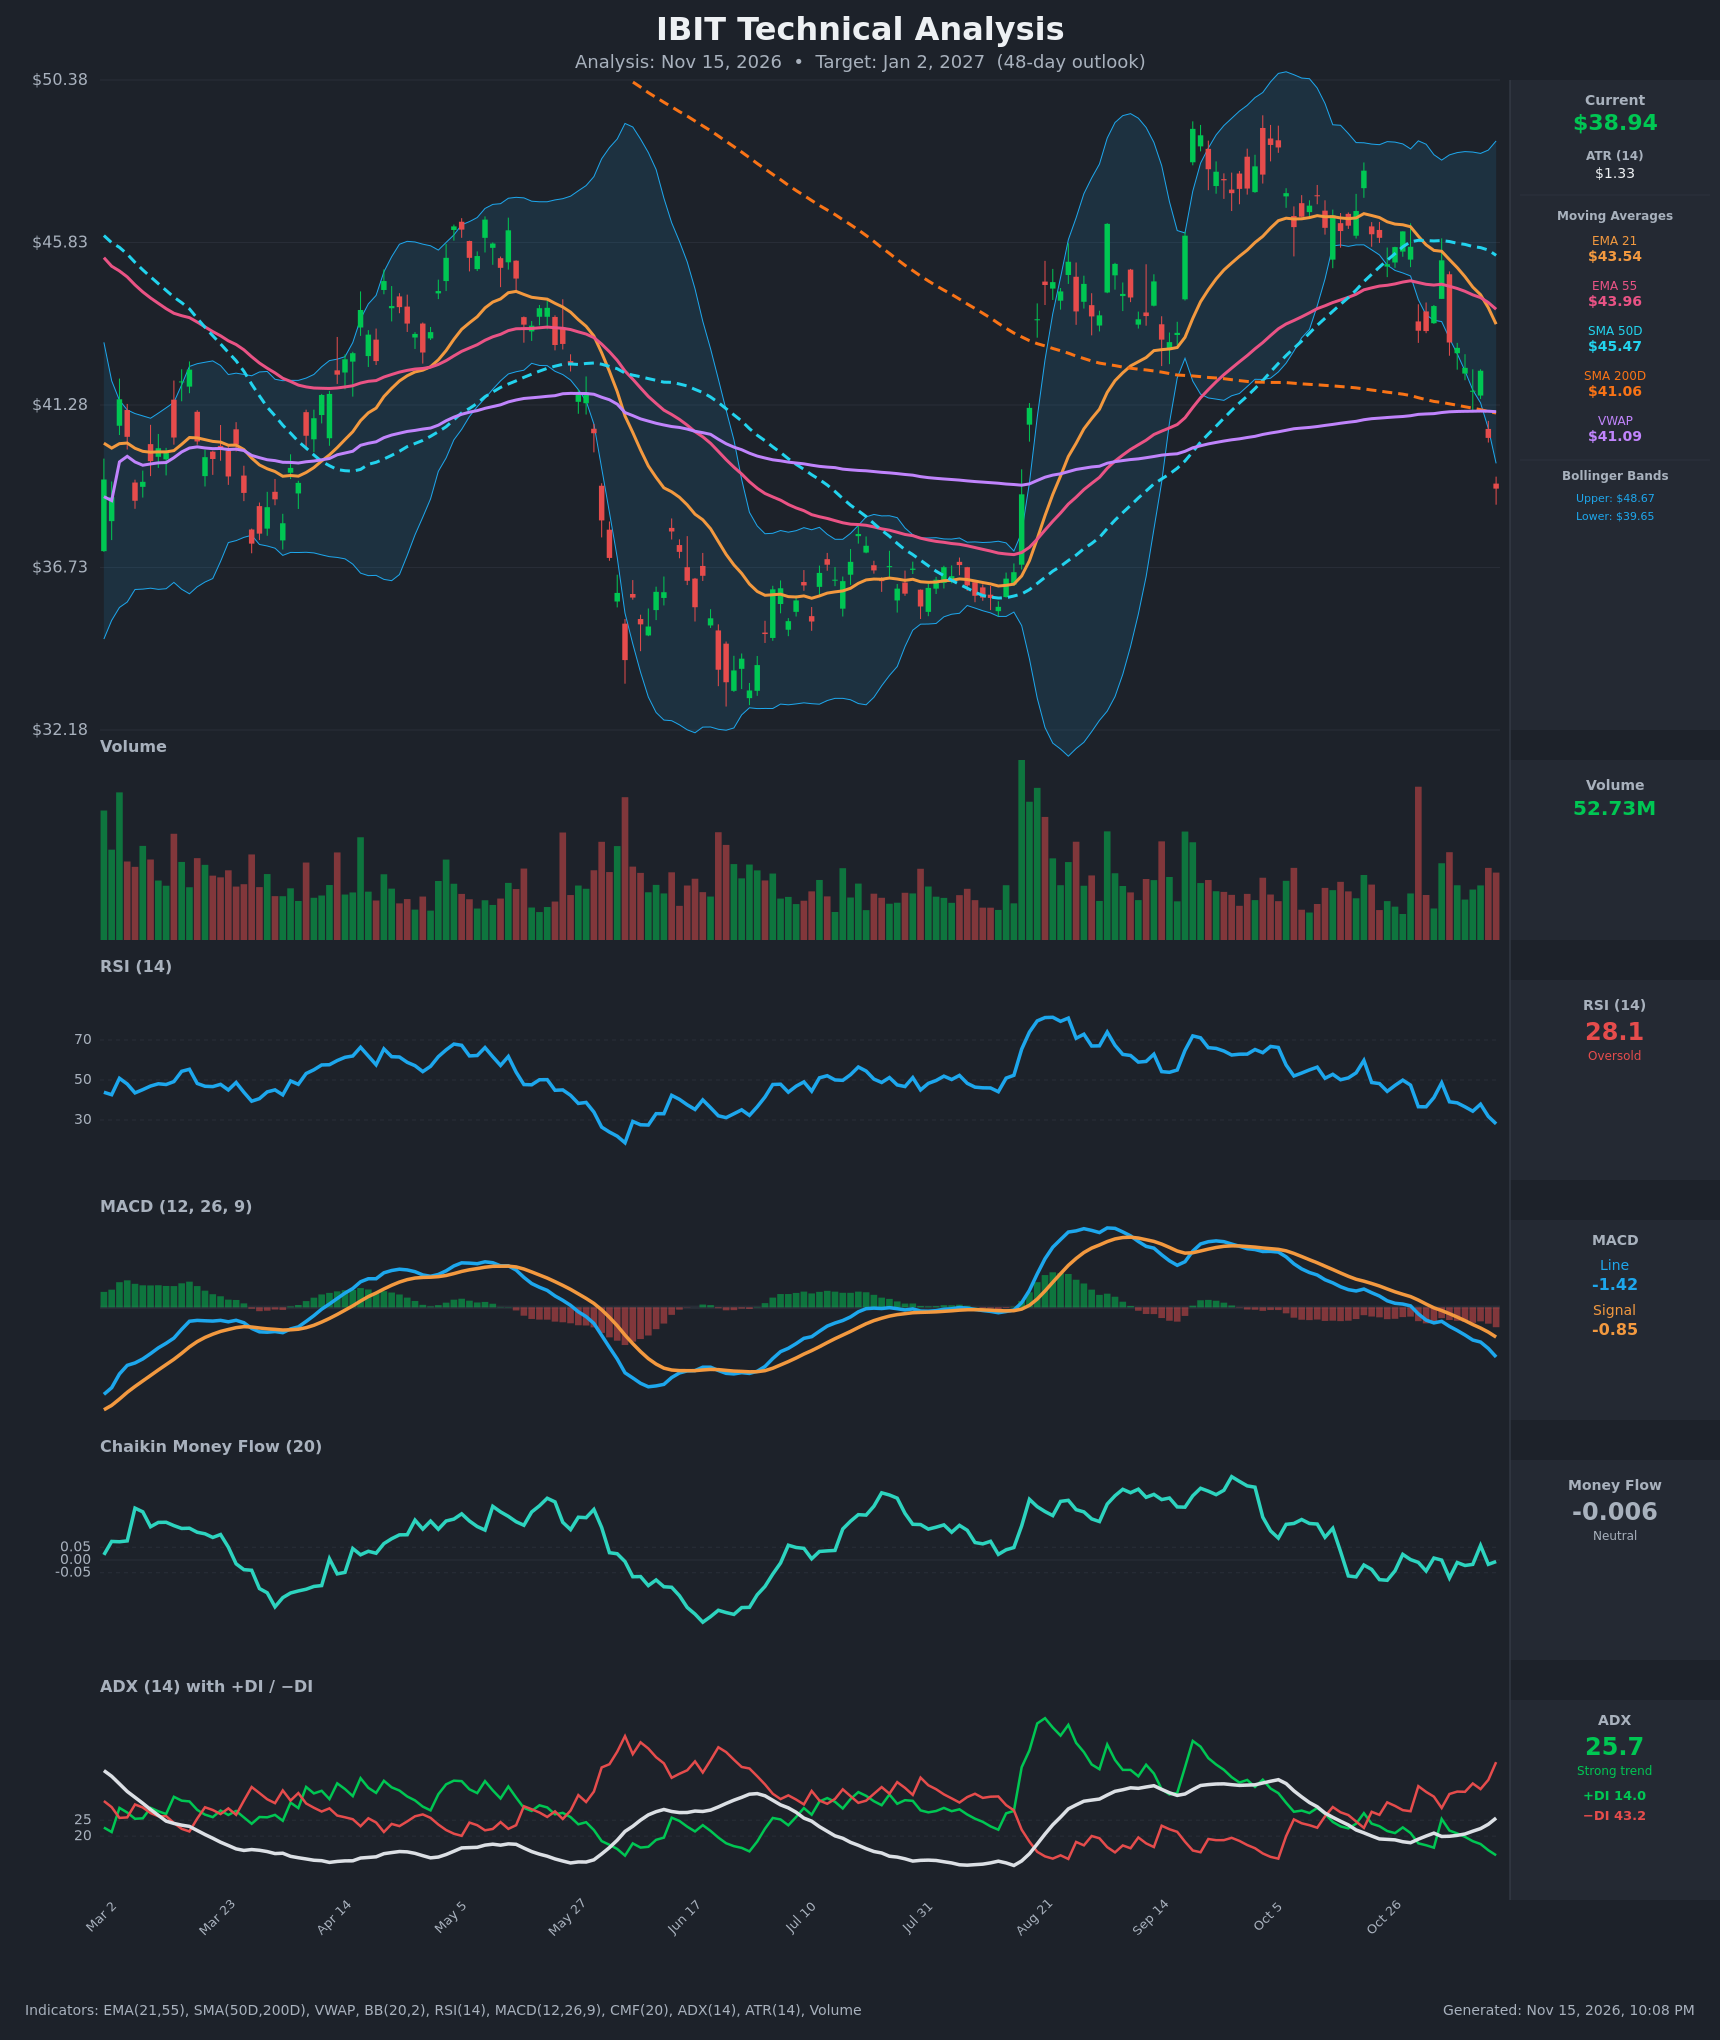
Analysis
TECHNICAL INDICATORS
- RSI (14): 28.08, in oversold territory and down from 48.6 on Nov 4. Momentum is still falling with no bullish divergence yet. It is the lowest reading since the May-June washout. [Bearish]
- 20 EMA: The 21 EMA is $43.54 and price at $38.94 is about 10% below it, so it acts as overhead resistance. The EMA21 has crossed below the EMA55 ($43.96), a bearish crossover on Nov 12-13. [Bearish]
- MACD: The line is -1.42 against a signal of -0.85. It crossed below the signal on Nov 3 and the negative histogram keeps widening, so downside momentum is accelerating. [Bearish]
- Bollinger Bands (20): Price is $38.94, below the lower band ($39.65) and far under the upper band ($48.67). That is a band-walk breakdown, which is oversold but also shows strong downside momentum. A snap-back toward the midline (around $44) is possible, though bands are wide, so the volatility is large. [Bearish]
- CMF (20): -0.006, which is neutral. It has hovered around zero for weeks without showing accumulation, so the sell-off has not been confirmed by heavy distribution. Dip buyers are not stepping in either. [Neutral]
- ADX (14): 25.7 and rising, with -DI at 43.2 against +DI at 14.0. The gap is very wide, with bears fully in control and a strong trend just confirmed. [Strong Trend – Bearish]
- Volume: 52.73M. Volume on the red candles is elevated versus the quiet October drift, consistent with a decisive break below the SMA200 ($41.06) and VWAP ($41.09). There is no capitulation spike yet like the one in late May. [Bearish – selling confirmed, no exhaustion]
DIVERGENCES & TRENDS
- There is no bullish RSI or MACD divergence. RSI and MACD are both making new lows alongside price, so the trend is confirmed rather than diverging.
- The 15-bar table shows a persistent deterioration. RSI went from 49.9 to 28.1, MACD turned negative on Oct 30, and −DI rose from 28 to 43 while +DI fell to 14.
- Price has broken below the SMA200 ($41.06), VWAP ($41.09), EMA21, EMA55 and SMA50 ($45.47), so the long-term trend is now in question.
- The SMA50 ($45.47) is still above the SMA200 ($41.06), so there is no death cross yet. The SMA50 is rolling over and the gap is narrowing, so one could develop within the 48-day window.
- Price has lost the lower Bollinger Band. The prior comparable oversold reading (RSI ~25 in late May) was followed by further downside before a base formed, which argues against an immediate V-bounce.
CHART PATTERNS
- Bearish Double Top (approximate): Peaks near $48-49 in September and early October produced a lower-high rollover. The neckline at about $42-43 has been broken, with a measured move of roughly $6 to $6.5, which points to $36-37.
- Support zone: The $34-37 area was the consolidation base from June to August, which is the logical landing zone.
- Bear flag-like drift: The October sideways-to-lower grind below the 21 EMA resolved downward, consistent with a continuation pattern.
- Counter-risk: Price is stretched below the bands, so a relief rally toward the SMA200/VWAP cluster at about $41 (a retest of broken support) is plausible before any further decline.
POTENTIAL SCENARIOS
- Scenario 1: Bearish Trend Continuation — Price retests the broken $41 SMA200/VWAP area or stalls below it, then continues lower toward the June-August base as −DI stays dominant and MACD keeps falling. Trigger: a daily close below $38 on sustained volume. Target: $35.00-$37.00, with an extreme low near $33. Invalidation: a daily close above $41.10 (SMA200/VWAP) with RSI back above 50. (50% probability)
- Scenario 2: Bullish Oversold Rebound — RSI at 28 and price below the lower band trigger a mean-reversion bounce toward the declining EMAs. Trigger: a reclaim of $39.65 (lower band) with a bullish RSI divergence or a volume capitulation reversal. Target: $41.00-$43.50 (SMA200/VWAP, then EMA21/55). Invalidation: a close back below $37.50. (35% probability)
- Scenario 3: Neutral Basing Range — Selling exhausts and price chops between about $36.50 and $41. Trigger: ADX fades below 20 and RSI stabilizes at 35-45. Target: about $38-$40. Invalidation: a close outside $36 or $41.50. (15% probability)
PRICE TARGETS
- Target Price: $37.00 (48-day horizon, roughly 5% below current)
- Expected Range: $34.00 to $40.80 (width $6.80, about 17.5% of current price, consistent with 30-60 day guidance)
- Key Levels: Support at $36.70, Resistance at $41.06
OVERALL BIAS
OVERALL BIAS: BEARISH - Price has broken below the SMA200, VWAP, all EMAs and the lower Bollinger Band, with a bearish MACD, ADX above 25 and −DI (43.2) far above +DI (14.0). A relief bounce toward $41 is likely along the way because RSI is oversold, but the trend and the double-top measured move favor a drift toward the $35-37 base.
This is educational analysis and not financial advice.