IBIT 27-day bearish forecast — Nov 15, 2026
- Bias: Bearish
- Timeframe: 27 days (made Nov 15, 2026, target date Dec 11, 2026)
- Price at analysis: $38.94
- Price target: $37.80
- Expected range: $35.40 – $41.20
- Result: Pending — graded after the close on Dec 11, 2026
Get a free AI analysis of IBIT today
Analysis
TECHNICAL INDICATORS
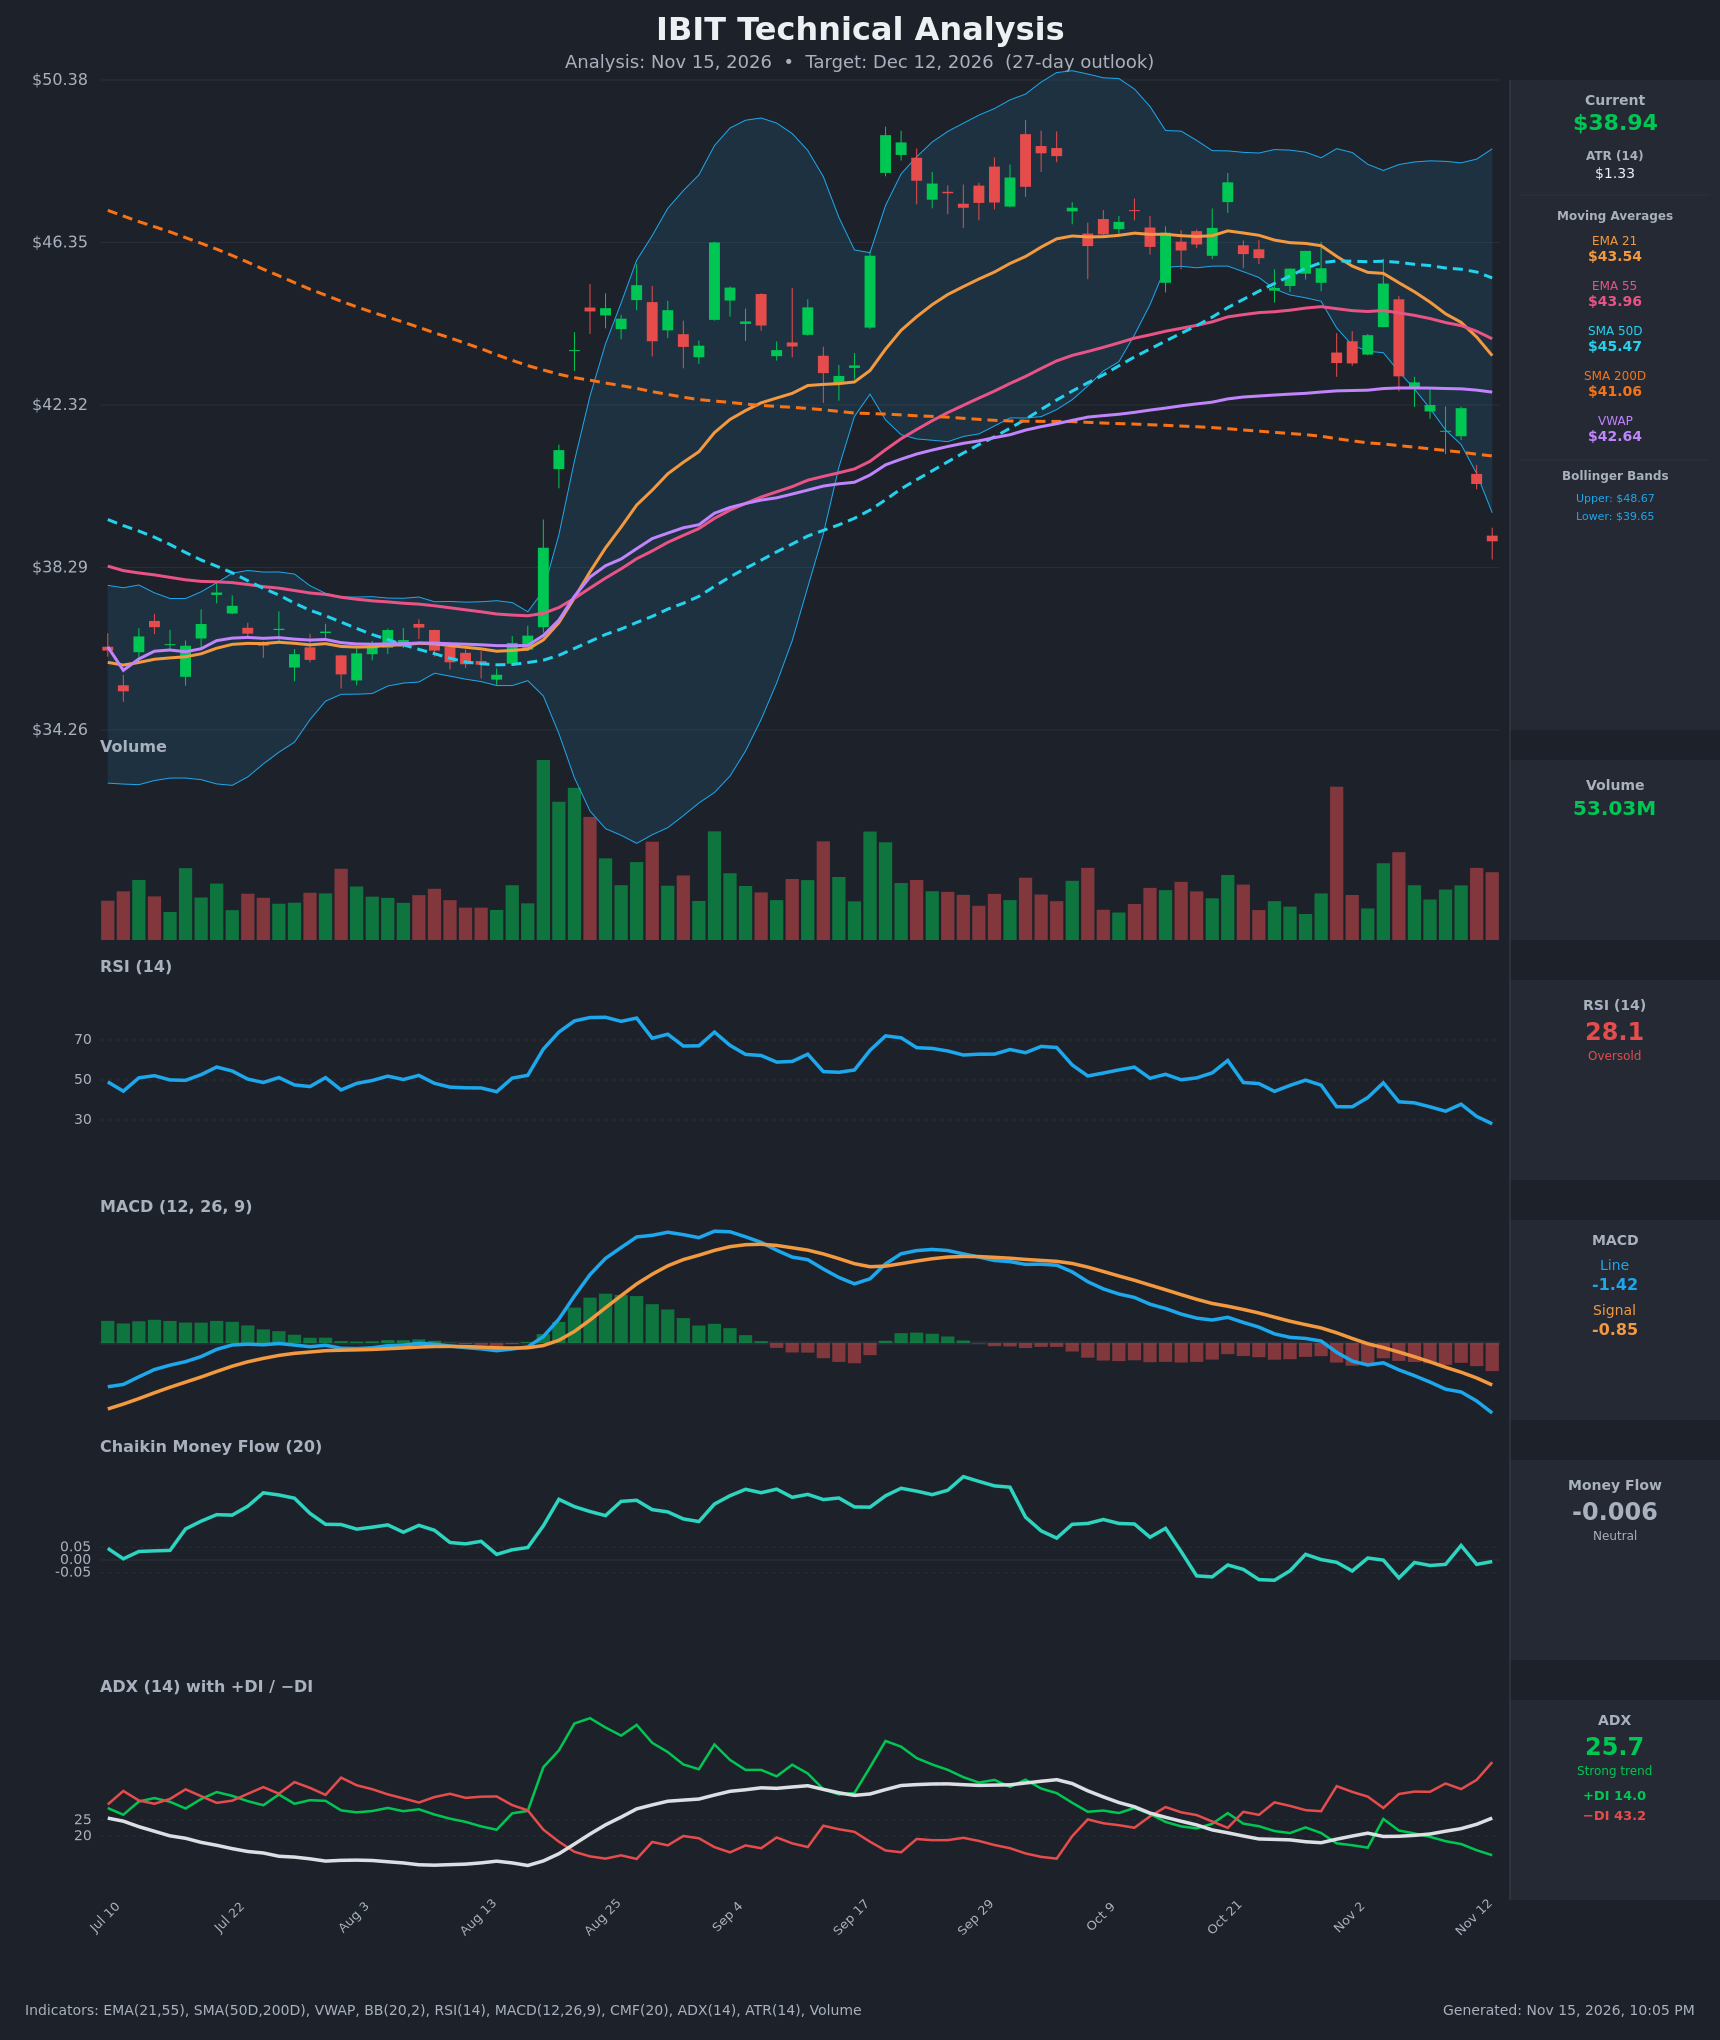
- RSI (14): 28.08, in oversold territory. It has dropped from about 49 on Oct 28 and has made lower readings nearly every session since. Momentum is still falling, with no bullish divergence yet. [Bearish]
- 20 EMA (EMA 21 = $43.54): Price at $38.94 is about 10.6% below it. The EMA is sloping down and is acting as overhead resistance. EMA21 crossed below EMA55 ($43.96) on Nov 12, a short-term bearish cross. [Bearish]
- MACD: The line is -1.42, below the signal at -0.85, and the histogram is negative and widening. The bearish crossover happened around Nov 3, and the gap is still expanding. [Bearish]
- Bollinger Bands (20): Price is below the lower band ($39.65) and well under the upper band ($48.67). This is a band-walk or extension, which signals strong downside momentum but also stretched, oversold conditions. A snap-back toward the mid-band (~$44) is possible. [Bearish]
- CMF (20): -0.006, inside the neutral zone. It has hovered near zero through the whole selloff, so there is no heavy distribution yet. Buying support is weak, but selling is not accelerating on this measure either. [Neutral]
- ADX (14): 25.7 and rising, with −DI (43.2) far above +DI (14.0). Bears are firmly in control, and the trend has moved from range-bound (ADX ~18–20) to a strong downtrend. [Strong Trend – Bearish]
- Volume: 53.03M, elevated, with the latest candles red. The breakdown is happening on solid volume rather than drying up. There is no sign of a capitulation spike yet. [Bearish – confirms selling]
Other trend context:
- Price is below SMA200 ($41.06), a break of the long-term trend line.
- Price is below SMA50 ($45.47) and VWAP ($42.64).
- The SMA50/SMA200 death cross has not happened yet, but the gap has narrowed from about $3.7 to $4.4 in the SMA50's favor and is still moving against bulls.
DIVERGENCES & TRENDS
- Divergences: There is no clear bullish RSI or MACD divergence. Both are making fresh lows with price. CMF holding near zero while price falls is a mild sign that selling is not aggressive.
- Trend:
- RSI went from 50 to 28 in about 12 sessions.
- MACD histogram has been growing more negative since early November.
- ADX is rising while −DI expands, which marks a trend with fresh momentum.
- Crossovers and breaks:
- Price broke below SMA200, EMA21 and EMA55 within the last few weeks.
- EMA21 crossed below EMA55 on Nov 12.
- The lower Bollinger Band was breached.
- The MACD bearish cross is about 8 sessions old.
- Price is nearing the August breakout zone around $36.7–$38.3.
CHART PATTERNS
- Bearish double top / rounded top (reversal): Price peaked near $49–50 in September, then made a lower high near $47 in October. It has since broken down through the neckline area (~$42–43) and the 200-day average. The measured move from the ~$49.50 peak down through ~$42.50 points to roughly $35–36.
- Possible descending channel / bearish flag character: The sequence of lower highs and lower lows since mid-October resembles the bearish continuation structure in the reference diagram.
- Support to watch: The Aug 13 gap-up base ($36.7–$38.3) is the next high-probability support zone. A tag of that area is likely before any durable bounce.
POTENTIAL SCENARIOS
- Scenario 1: Bearish Trend Continuation to the August Base — Strong ADX with −DI dominance, a widening MACD and a SMA200 breakdown favor further downside toward the prior breakout base, with only weak relief bounces capped near the EMAs. Trigger: Daily close below ~$38.30 / the Nov 13 low. Target: $36.80, with an extension to $35.50. Invalidation: Daily close above $41.06 (SMA200). (55% probability)
- Scenario 2: Bullish Oversold Bounce — RSI near 28 and price below the lower Bollinger Band often produce mean-reversion rallies, especially after a 7–8 session slide. A reclaim of the lower band and the SMA200 would turn price toward the EMA cluster. Trigger: Close above $39.65, then above $41.06. Target: $42.60 (VWAP), then $43.50 (EMA21). Invalidation: Close below $37.50. (35% probability)
- Scenario 3: Neutral Base-Building Chop — Price stabilizes in the high-$30s to low-$40s as momentum fades and CMF stays near zero. Trigger: Several closes between $37.50 and $41. Target: $38–$40. Invalidation: Close outside $36.80–$41.50. (10% probability)
PRICE TARGETS
Range width check: $41.20 − $35.40 = $5.80, about 14.9% of $38.94. That fits the 27-day horizon (between the 14–21 day band of ~8–12% and the 30–60 day band of ~12–18%).
- Target Price: $37.80 (27-day, about 2.9% below current)
- Expected Range: $35.40 to $41.20
- Key Levels: Support at $36.80, Resistance at $41.06
OVERALL BIAS
OVERALL BIAS: BEARISH - ADX is rising above 25 with −DI at 43 versus +DI at 14, MACD is below signal with a widening negative histogram, and price has broken below SMA200 and all key moving averages on elevated volume. Oversold RSI raises the odds of a relief bounce, but the trend evidence favors a drift toward the $36.80 base over the next 27 days.
This is educational analysis and not financial advice.