IBIT 83-day bearish forecast — Nov 15, 2026
- Bias: Bearish
- Timeframe: 83 days (made Nov 15, 2026, target date Feb 5, 2027)
- Price at analysis: $38.94
- Price target: $37.00
- Expected range: $33.00 – $42.00
- Result: Pending — graded after the close on Feb 5, 2027
Get a free AI analysis of IBIT today
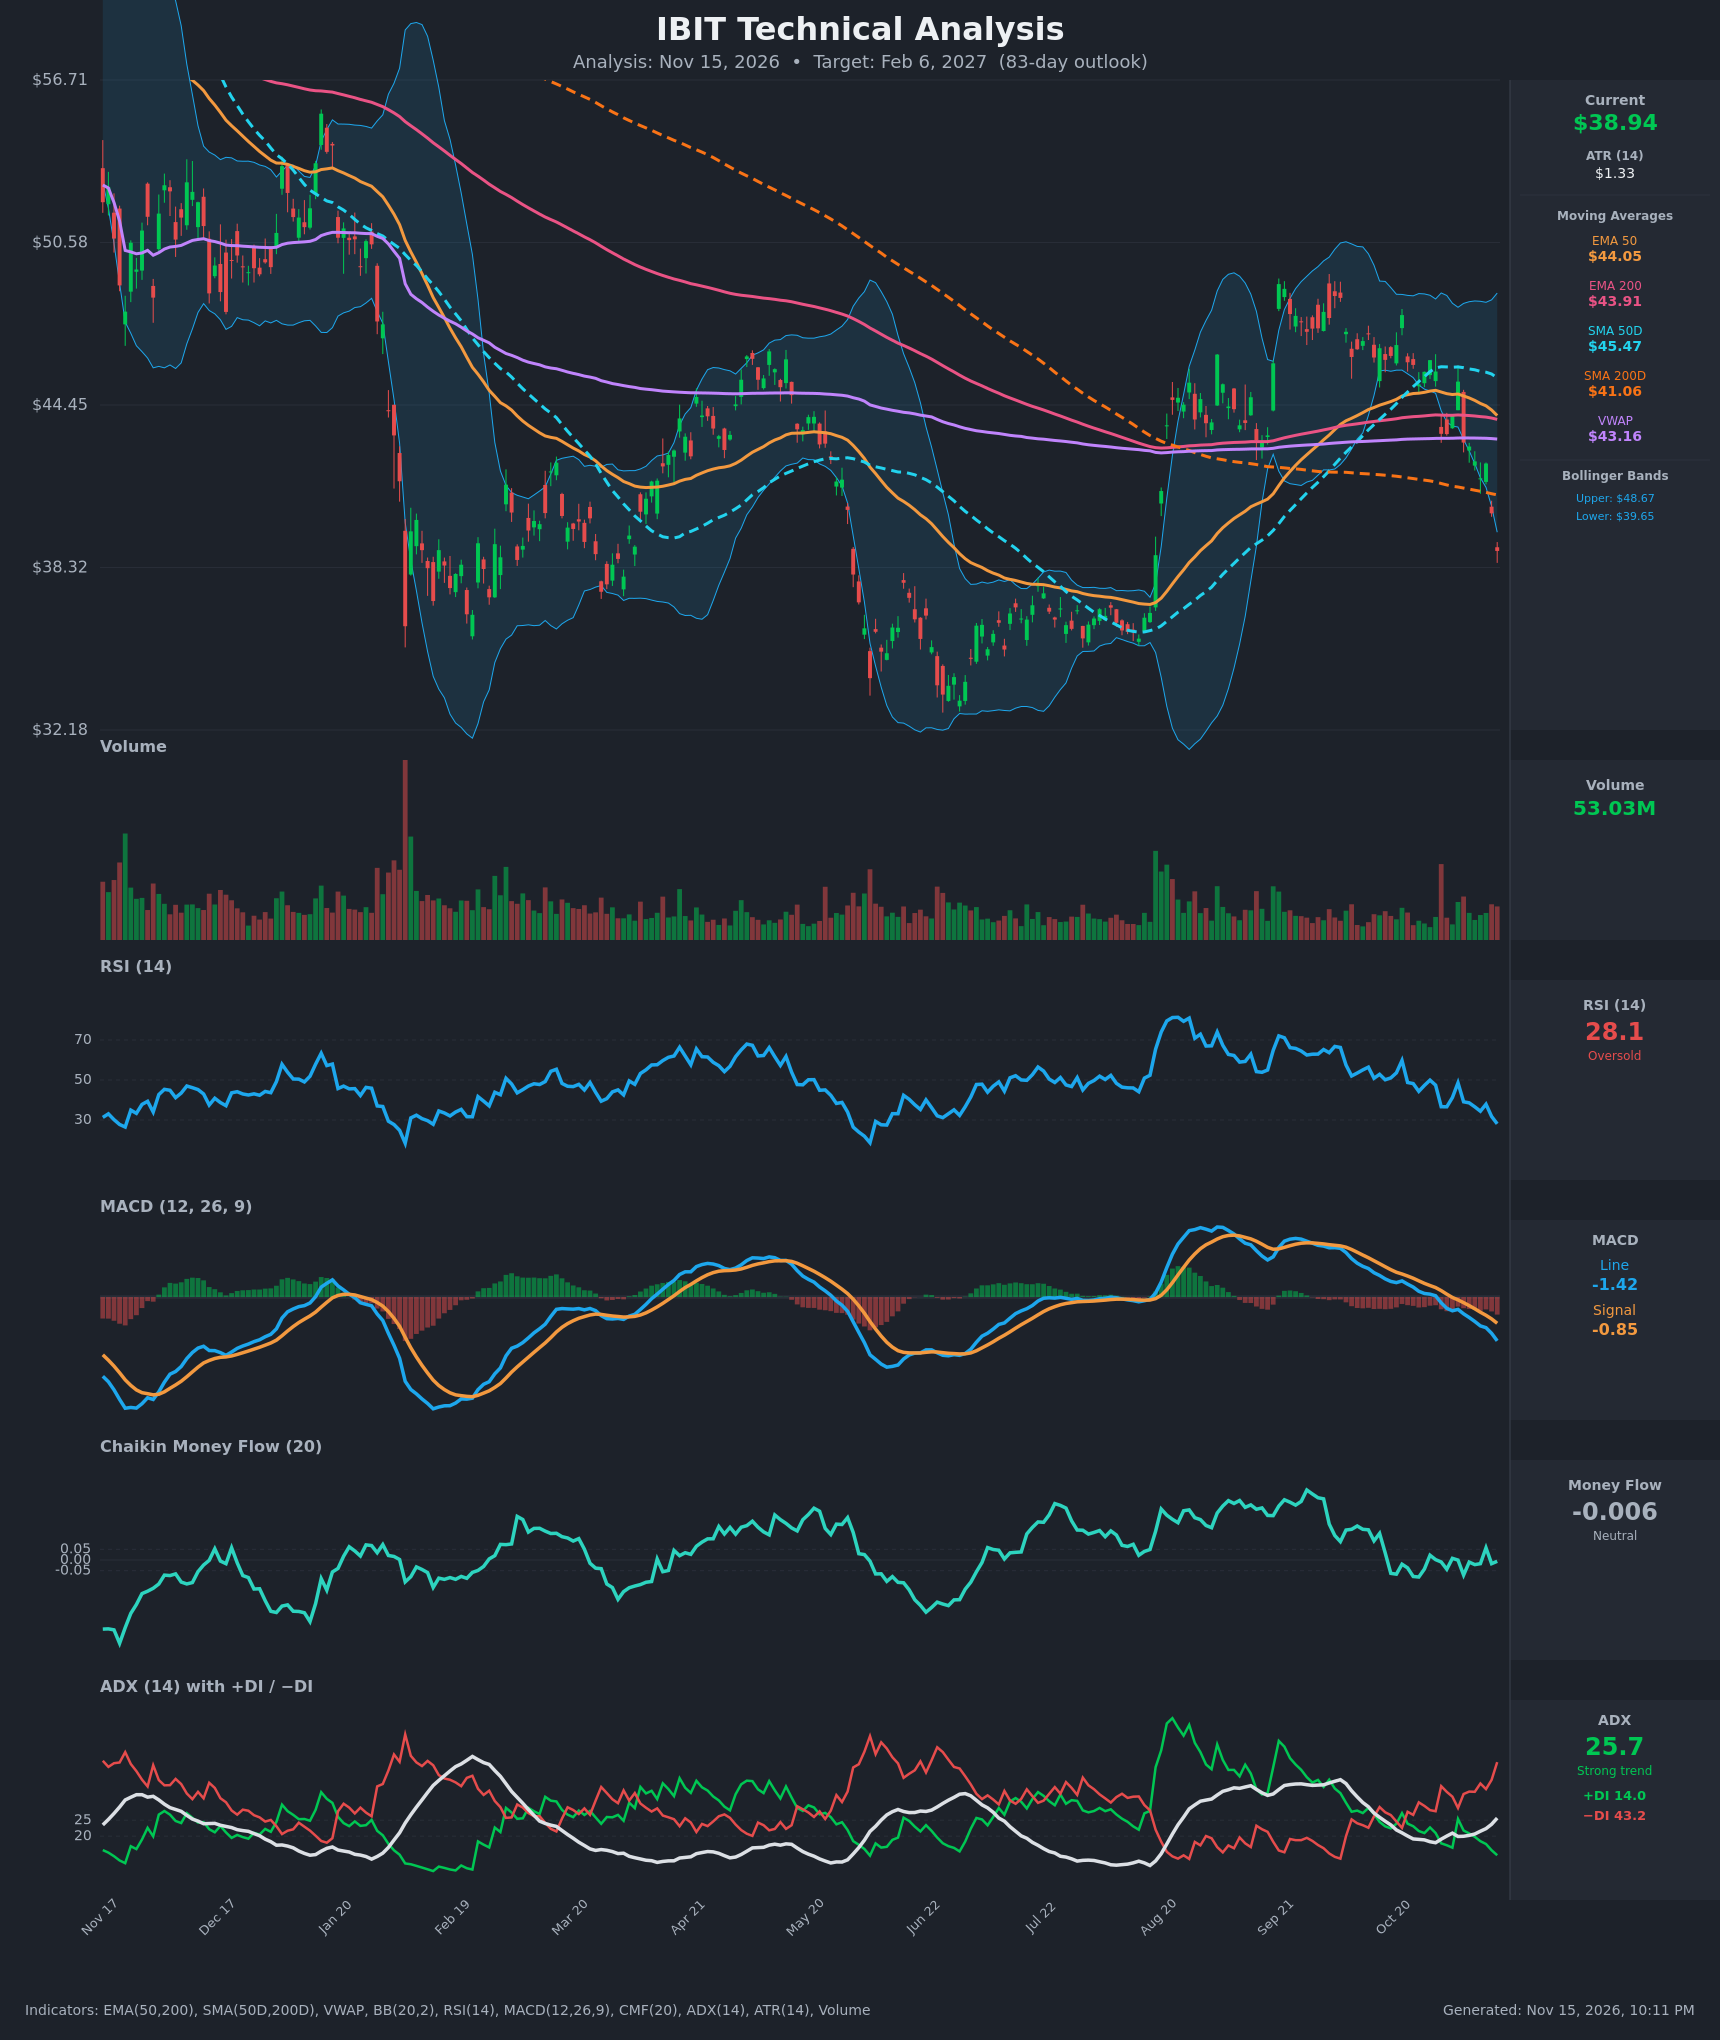
Analysis
TECHNICAL INDICATORS
- RSI (14): 28.08, in oversold territory and down from 48.6 on Nov 4. Momentum is falling steadily with no bullish divergence yet, and RSI can stay oversold in a strong downtrend. [Bearish]
- 20 EMA: No 20 EMA value was supplied, so the EMA 50 at $44.05 serves as the proxy. Price at $38.94 is about 11.6% below it, and the EMA 50 is sloping down. EMA 50 ($44.05) is only slightly above EMA 200 ($43.91), so a bearish EMA crossover is imminent. The 50 and 200 EMAs and VWAP ($43.16) are all stacked overhead as resistance. [Bearish]
- MACD: Line at -1.42, below the signal at -0.85. The bearish crossover occurred around Nov 3, and the negative histogram has widened every day since. This is accelerating downside momentum. [Bearish]
- Bollinger Bands (20): Price ($38.94) is below the lower band ($39.65), with the upper band at $48.67. This is a band walk after a sharp drop from the midline, and the band is turning down. It is oversold and stretched, which raises the odds of a bounce, but it is not a reversal signal on its own. [Bearish]
- CMF (20): -0.006, inside the neutral band (±0.05), after hovering around zero for weeks. There is no accumulation to support a bounce. Price has fallen without a meaningful rise in distribution, so the signal is non-confirming. [Neutral]
- ADX (14): 25.7 and rising from about 19 on Oct 28. −DI at 43.2 is far above +DI at 14.0, and the gap has widened sharply. Bears are firmly in control of a strengthening downtrend. [Strong Trend – Bearish]
- Volume: 53.03M, elevated on the latest red candle and well above recent quiet-session levels. This confirms the breakdown with real selling. It could also mark the start of capitulation, but there is no volume spike or reversal bar yet. [Bearish confirmation]
DIVERGENCES & TRENDS
- There is no bullish RSI or MACD divergence. Both made new lows alongside price (RSI 28.1, MACD -1.42), so momentum confirms the decline.
- The MACD bearish crossover (Nov 3) and ADX turning up with −DI dominant show a trend that is strengthening, not exhausted.
- Price has lost the SMA 200D ($41.06), the EMA 50, the EMA 200, the SMA 50D ($45.47) and VWAP. Price is below the SMA 200D, which signals a long-term downtrend.
- The SMA 50D is still above the SMA 200D, so there is no death cross yet. The EMA 50/200 gap is only $0.14 and closing, so a bearish EMA cross is likely within days.
- Price made lower highs from about $49 in September to about $46 in October, and then broke the $41.7–$43 support base.
- Earlier oversold episodes (Feb and Jun) ended in sharp rebounds from roughly $33–$36. That makes the $35–$36 zone (the August base) a key reaction area, and oversold bounces are plausible within the downtrend.
CHART PATTERNS
- Bearish lower-highs sequence / loose Bearish Head and Shoulders or Double Top (September–October peaks): Neckline-style support near $41.7–$43 has broken. The measured move from the roughly $46–$49 highs to the $43 support is about $4–$6, which projects to about $37–$39 and is largely achieved. Extension would head toward the $35–$36 August base.
- No confirmed Bullish Reversal pattern (double bottom, falling wedge or inverted head and shoulders) has formed yet. A close back above $41 with rising CMF would be the first sign of a base.
- The pattern read is bearish continuation with a modest-conviction target, because oversold conditions limit downside follow-through.
POTENTIAL SCENARIOS
- Scenario 1: Bearish Trend Continuation to the August Base — The breakdown extends with the EMA 50/200 cross, MACD staying negative and ADX rising. Price retests the $35–$36 support zone and may probe lower. Trigger: failed bounces below $41 and daily closes under $37.50. Target: $35.00–$36.00, with a possible overshoot to $33.50. Invalidation: daily close above $41.06 (SMA 200D). (45% probability)
- Scenario 2: Neutral/Bearish Oversold Bounce, Then Fade — An RSI-driven relief rally toward the broken SMA 200D and VWAP area fails at overhead resistance. Price settles in the high-$30s to low-$40s. Trigger: a bullish RSI divergence or a reversal candle on high volume. Target: $40.50–$42.00, then a rollover. Invalidation: a sustained close above $44.05 (EMA 50). (30% probability)
- Scenario 3: Bullish Reversal and Recovery — Capitulation near $35–$36 sets a double-bottom or base. Price reclaims the SMA 200D and EMA 50/200, with CMF turning positive. Trigger: close above $41.06 and then $44.05 with CMF above +0.05. Target: $44.00–$46.00. Invalidation: close below $35.00. (25% probability)
PRICE TARGETS
- Target Price: $37.00 (83-day horizon, Feb 6, 2027)
- Expected Range: $33.00 to $42.00 (width $9.00 = about 23% of current price, consistent with the 61–180 day guidance of 18–30%)
- Key Levels: Support at $35.50, Resistance at $41.06
OVERALL BIAS
OVERALL BIAS: BEARISH - Price is below all key moving averages and the lower Bollinger Band, with a bearish MACD crossover, −DI (43.2) far above +DI (14.0), ADX rising above 25, and an imminent EMA 50/200 bearish cross. Oversold RSI (28) argues for bounces, so the target is a modest $37.00, with the $35–$36 base as the likely destination.
This is educational analysis and not financial advice.