IBIT 62-day bearish forecast — Nov 15, 2026
- Bias: Bearish
- Timeframe: 62 days (made Nov 15, 2026, target date Jan 15, 2027)
- Price at analysis: $38.94
- Price target: $37.00
- Expected range: $32.50 – $41.50
- Result: Pending — graded after the close on Jan 15, 2027
Get a free AI analysis of IBIT today
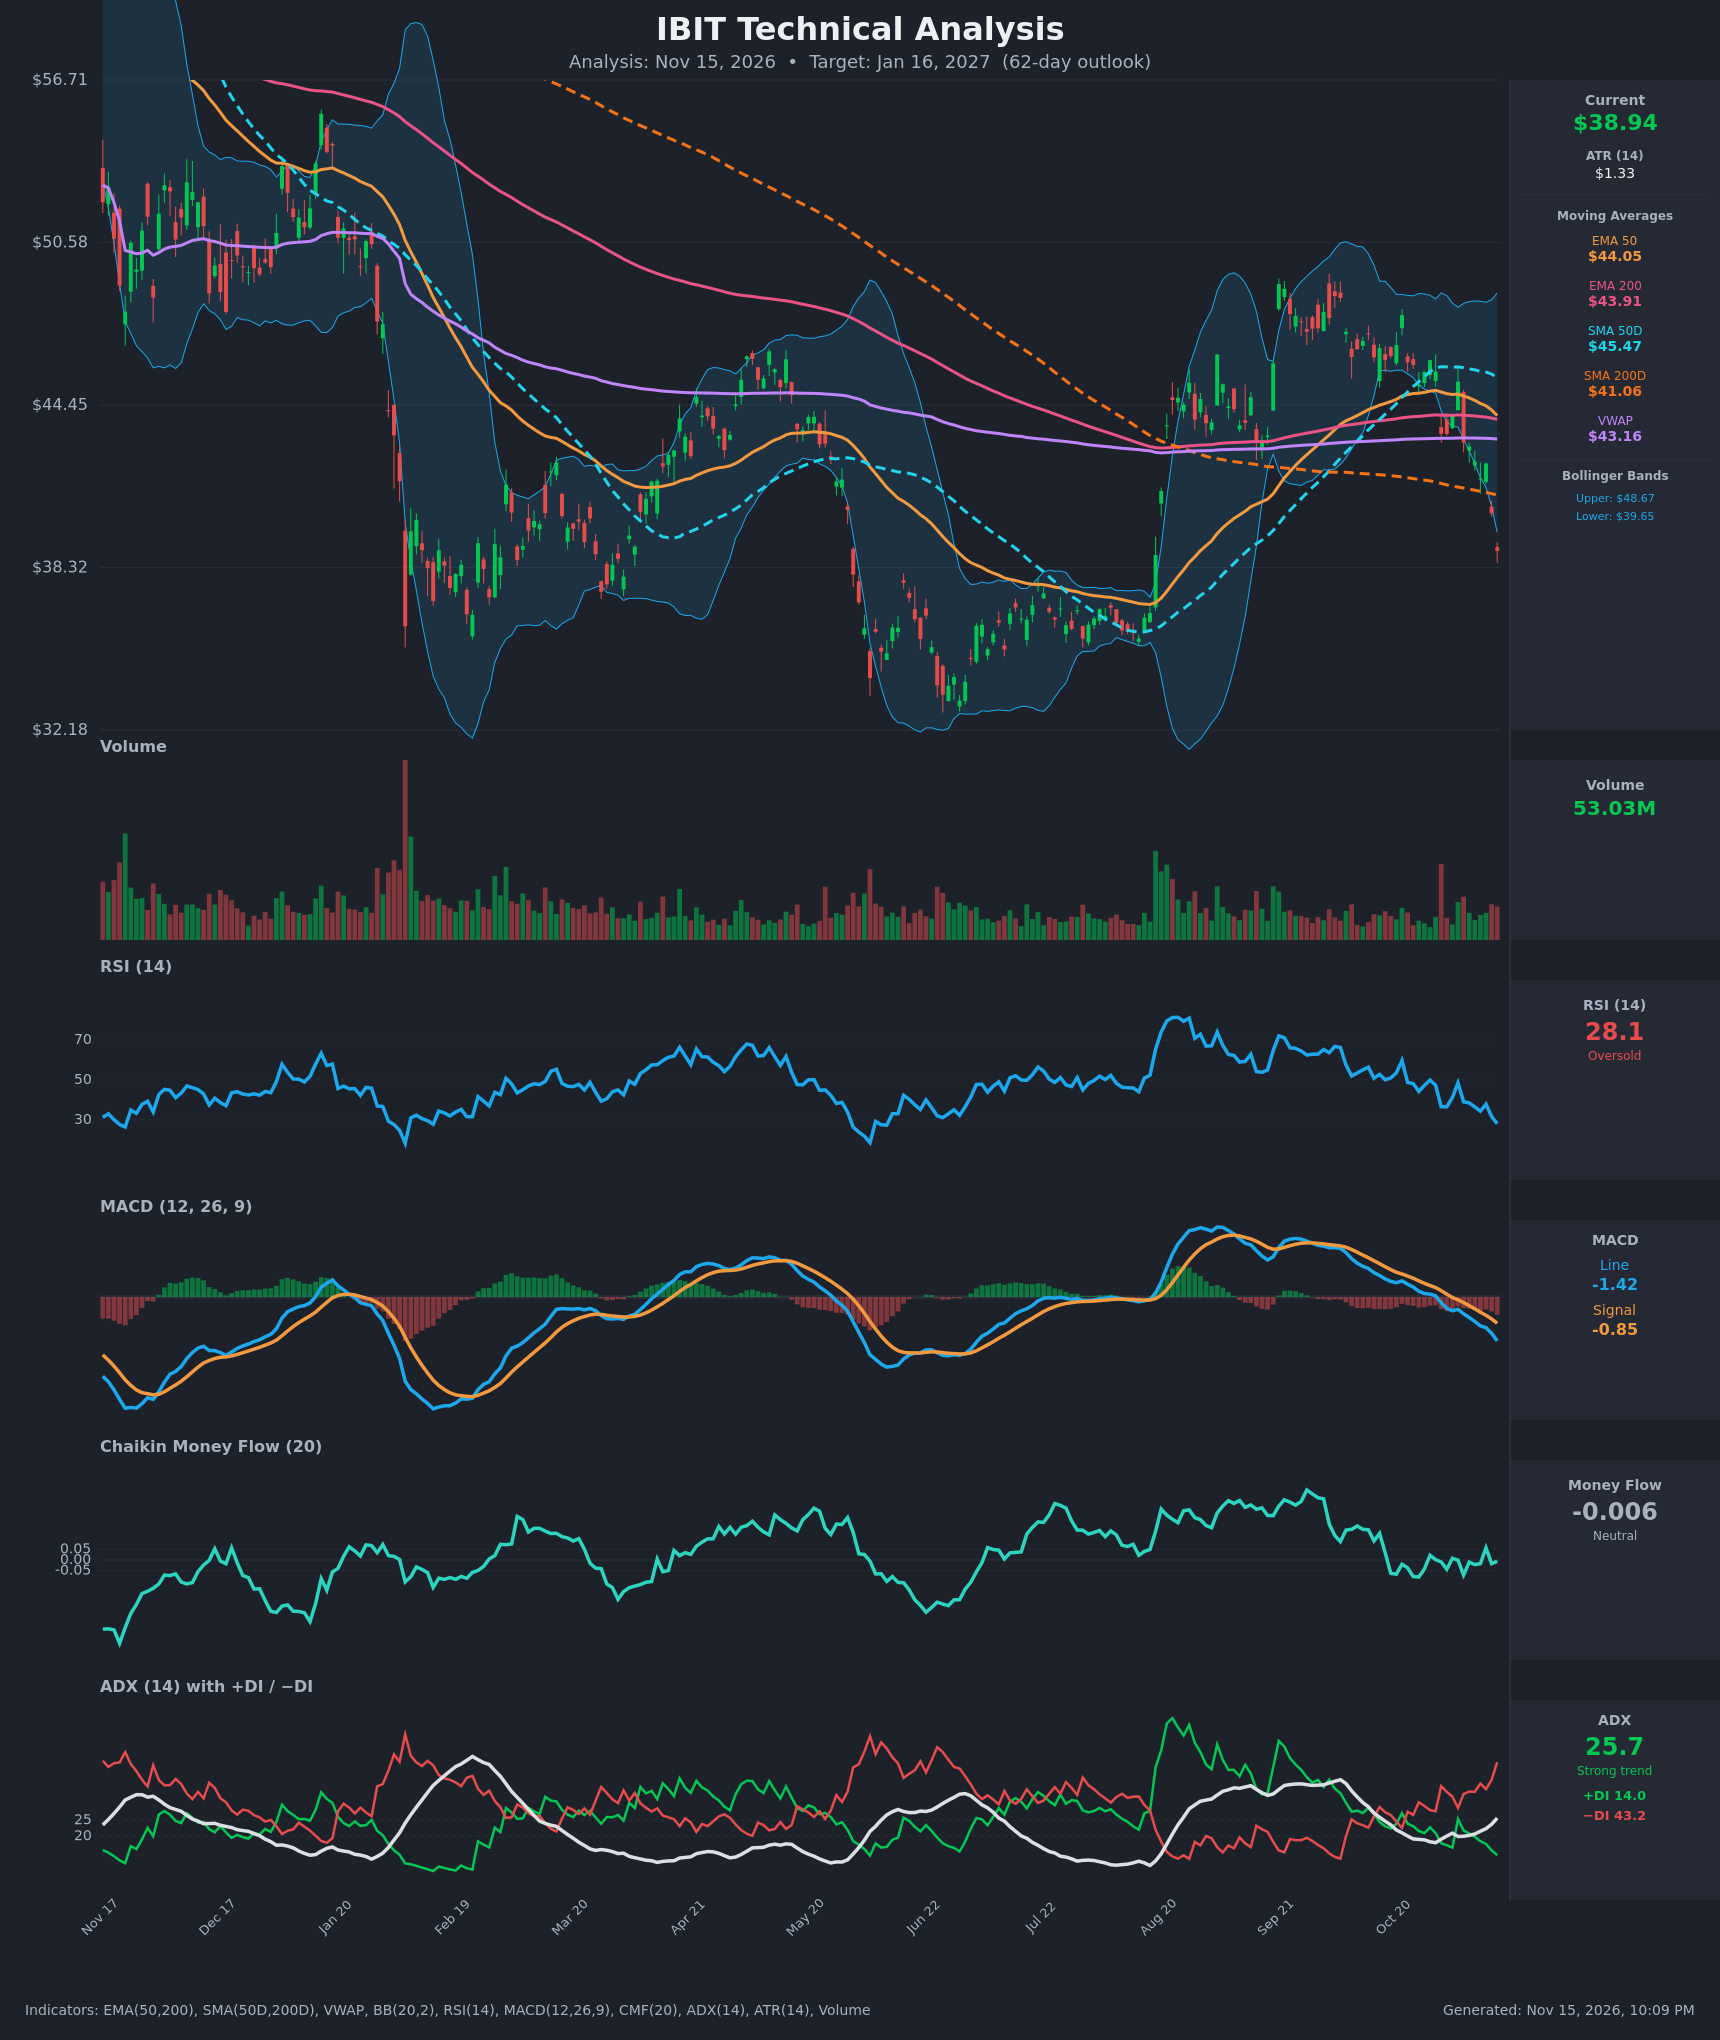
Analysis
TECHNICAL INDICATORS
- RSI (14): 28.08, oversold and down from 48.6 on Nov 4. Momentum is still falling, and it sits just below the 30 line. Oversold readings on this chart (Feb, Jun) were followed by further lows or choppy bottoms before any durable recovery. [Bearish]
- 20 EMA: Not supplied. The nearest proxies are EMA 50 at $44.05 and VWAP at $43.16, both about 11-13% above price. Price has lost the EMA 50 and is trading well below it, so these now act as overhead resistance. [Bearish]
- MACD: Line -1.42 is below signal -0.85, with the gap widening (histogram about -0.57 and expanding). The bearish crossover happened around Nov 3 and momentum keeps accelerating down. [Bearish]
- Bollinger Bands (20): Price at $38.94 is below the lower band ($39.65), with the upper band at $48.67. The wide bands show expanded volatility. A close outside the lower band signals strong downside momentum and may precede a snap-back toward the midline, but in a trend it often "walks the band". [Bearish]
- CMF (20): -0.006 is neutral and hovering around zero since mid-October. Buying pressure has faded from the strong positive readings of Aug-Sep, but heavy distribution is not yet confirmed. [Neutral]
- ADX (14): 25.7 and rising (from 18 about two weeks ago), with -DI 43.2 far above +DI 14.0. This is a strong, accelerating downtrend with bears firmly in control. [Strong Trend – Bearish]
- Volume: 53.03M, elevated relative to the recent average, on a down leg that broke through the SMA 200 at $41.06. Heavy volume on a breakdown supports the move, though it can also mean capitulation. [Bearish with possible capitulation risk]
DIVERGENCES & TRENDS
- There is no bullish RSI divergence yet. RSI is making new lows alongside price, which confirms the decline.
- MACD, RSI and ADX/DI all point down together. The DI spread (+DI 14 vs −DI 43) is the widest since the Jan-Feb selloff.
- Price has fallen from $46.14 (Oct 28) to $38.94, about -16% in 12 sessions, with a series of lower highs and lower lows.
- EMA 50 ($44.05) is converging on EMA 200 ($43.91) and is about to cross below it, which would be a death cross on the exponential averages.
- SMA 50 ($45.47) is still above SMA 200 ($41.06), so the longer-term golden cross is intact, but SMA 50 is rolling over.
- Price has broken below the SMA 200 and VWAP, which shifts the long-term structure to bearish.
- CMF is flat near zero, the one indicator not confirming heavy selling.
CHART PATTERNS
- There is no textbook pattern. The structure resembles a Bearish Head and Shoulders / Double Top from the Aug-Sep high near $49-50 and the lower high near $46 in late October. The breakdown below the ~$41-42 "neckline" (SMA 200 and the Aug-Oct base) is bearish.
- Measured-move targets from that neckline point toward the mid-$30s, near the Aug base of about $35-36 and potentially the $32-33 June low.
- The decline may also be a Bearish Flag/Pennant continuation after the earlier rally, with the same downside implication.
- A reclaim of $41-42 would invalidate the breakdown and turn it into a false break (bull trap).
POTENTIAL SCENARIOS
- Scenario 1: Bearish Trend Continuation — Strong ADX and −DI dominance, a MACD still accelerating down and a break of the SMA 200 favor a further leg toward the August base, possibly with a bounce along the way. Trigger: daily close below $38 with volume holding. Target: $35.50, then $33-34. Invalidation: daily close above $41.10 (SMA 200). (50% probability)
- Scenario 2: Bullish Oversold Rebound — RSI under 30 and a close below the lower Bollinger Band set up a mean-reversion bounce toward the SMA 200 and the falling averages. Trigger: bullish reversal candle with RSI turning up above 30 and a MACD histogram uptick. Target: $41-43. Invalidation: close below $36. (35% probability)
- Scenario 3: Neutral Base Building — Price stabilizes between the Aug low area and the SMA 200 as selling exhausts and CMF stays near zero. Trigger: several sessions of tight closes between $36 and $41. Target: $37-40. Invalidation: close outside $35-$42. (15% probability)
PRICE TARGETS
- Target Price: $37.00 (62-day horizon, Jan 16, 2027)
- Expected Range: $32.50 to $41.50 (width $9.00, about 23% of current price, consistent with the 18-30% guidance for 61-180 days)
- Key Levels: Support at $35.50 (Aug base), Resistance at $41.06 (SMA 200)
OVERALL BIAS
OVERALL BIAS: BEARISH - Price has broken below the lower Bollinger Band and the SMA 200 with a bearish MACD, a rising ADX (25.7) and −DI (43.2) dominating +DI (14.0). Oversold RSI raises the odds of a bounce, but the trend evidence favors a drift toward the $35-37 area over the next 62 days.
This is educational analysis and not financial advice.