IBIT 6-day bearish forecast — Nov 1, 2026
- Bias: Bearish
- Timeframe: 6 days (made Nov 1, 2026, target date Nov 6, 2026)
- Price at analysis: $43.35
- Price target: $42.70
- Expected range: $41.70 – $44.30
- Result: Correct (-1.1%) — closed at $42.86 on Nov 6, 2026; quality score 100/100
Get a free AI analysis of IBIT today
Analysis
TECHNICAL INDICATORS
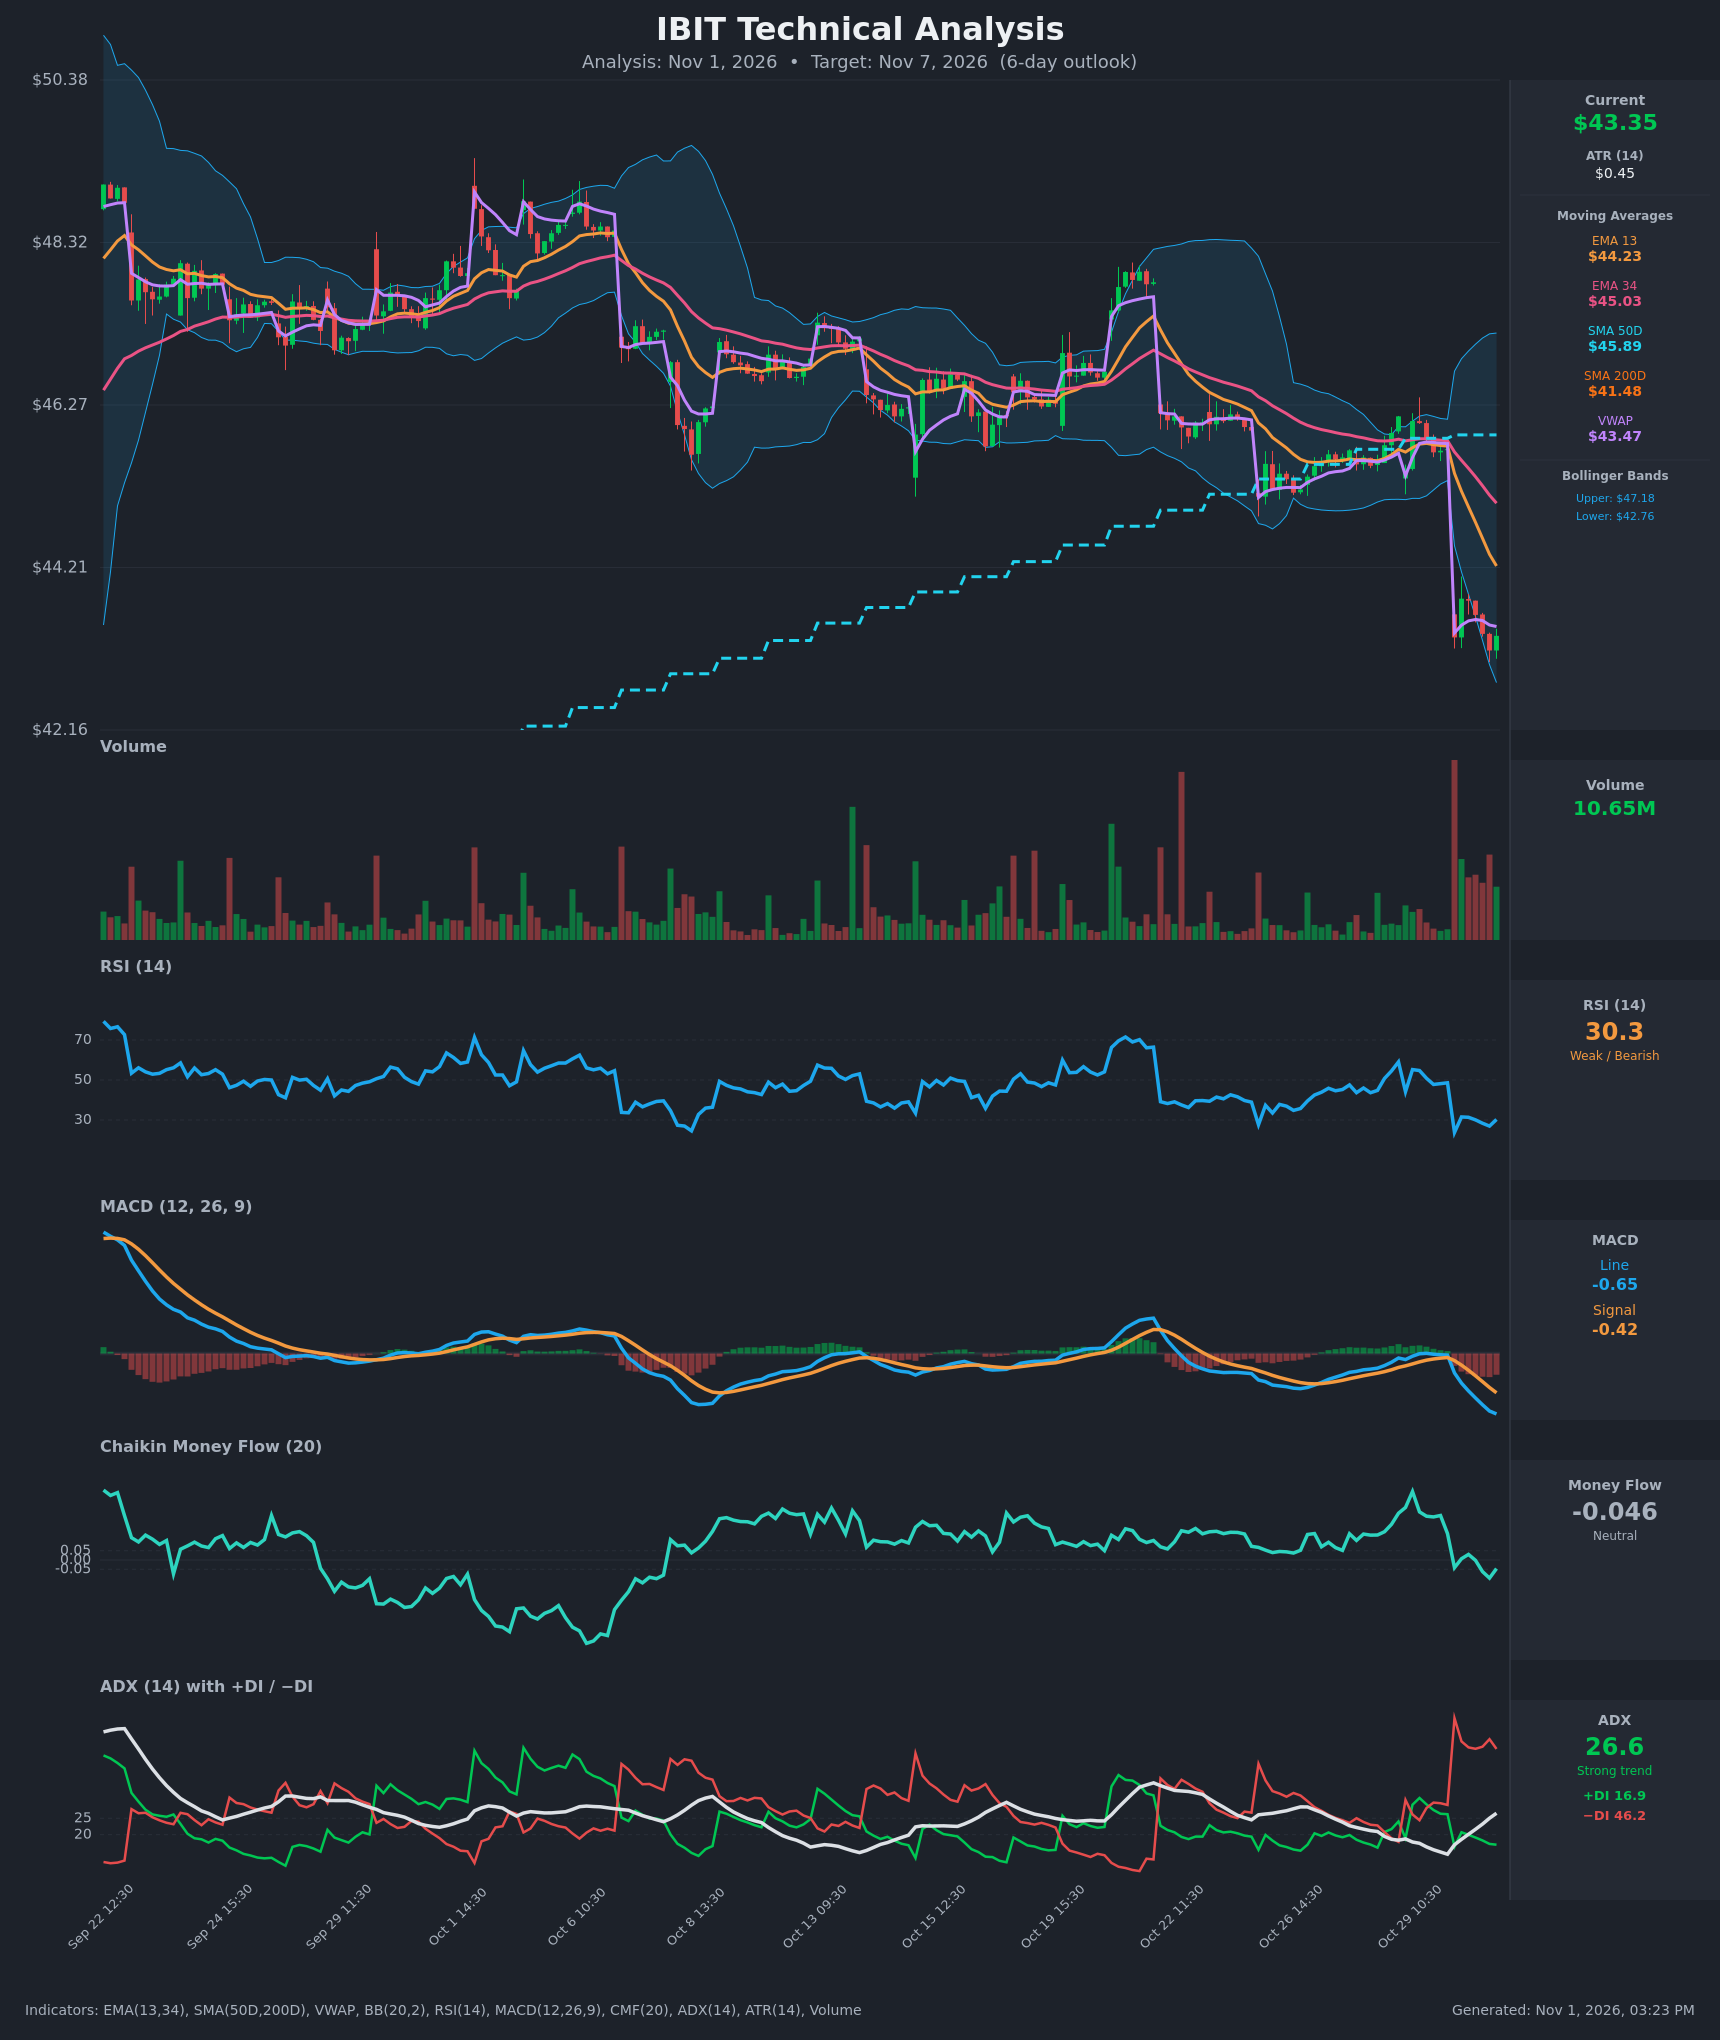
- RSI (14): 30.27, right at the oversold threshold. It collapsed from about 49 to 23.8 on the Oct 30 gap-down and has since held in the 27-31 range with no real recovery. Momentum is weak, though a short-term bounce is possible. [Bearish]
- 20 EMA: No 20 EMA is supplied, so I use the EMA 13 ($44.23) and EMA 34 ($45.03) instead. Price is below both, and EMA 13 is falling steeply toward and below EMA 34, so a bearish EMA cross is in progress. Both act as overhead resistance. [Bearish]
- MACD: Line -0.648 is below signal -0.421 and widening, and the histogram is negative and growing. The cross happened on Oct 30 and momentum is accelerating down. [Bearish]
- Bollinger Bands (20): Upper $47.18, lower $42.76. Price at $43.35 is in the lower part of the bands, about $0.59 above the lower band, after briefly touching it on the gap. The bands are widening, which signals expanding volatility. Price is oversold but not yet "walking" the band. [Bearish]
- CMF (20): -0.046, which is neutral (just above the -0.05 threshold). It fell from +0.25 and +0.37 earlier in the week, a sharp swing toward distribution. [Neutral]
- ADX (14): 26.6 and rising, with −DI (46.2) far above +DI (16.9). The trend is strong and bears are firmly in control. [Strong Trend – Bearish]
- Volume: 10.65M, with the Oct 30 gap-down bar the highest volume on the chart. That confirms heavy, decisive selling (a breakdown), though a blow-off or capitulation element is possible. [Bearish – confirms breakdown]
DIVERGENCES & TRENDS
- There is no bullish RSI or MACD divergence yet. RSI made lower lows with price, and MACD is still making new lows.
- The MACD bearish crossover (Oct 30 09:30) and the EMA 13 / EMA 34 bearish cross are both confirmed and widening.
- Price is below EMA 13, EMA 34, SMA 50D ($45.89) and VWAP ($43.47). It is still above SMA 200D ($41.48), so the long-term trend is intact but under pressure.
- Price held a $45.5-$46.3 range for several days, then gapped about $2.35 lower on Oct 30. This is a clean range breakdown.
- Since the gap, price has made lower highs ($43.82, then $43.35) with a weak intraday bounce. The gap is unlikely to fill within 6 days.
- The oversold RSI and the proximity to the lower Bollinger Band argue for a relief bounce. The ADX and −DI readings suggest any bounce will be sold into.
CHART PATTERNS
- The closest reference pattern is a bearish breakdown from a consolidation (similar to a bearish pennant or flag, or a descending-triangle-style range break). Price consolidated for days below the SMA 50 and then broke down on a gap with heavy volume.
- The measured move of the roughly $0.8 range plus the gap points toward the SMA 200D area ($41.48), where larger support sits.
- Immediate resistance is the gap zone and EMA 13 near $44.23. A reclaim of $44.25 or higher would neutralize the pattern.
- No reversal pattern (double bottom, falling wedge) is visible yet.
POTENTIAL SCENARIOS
- Scenario 1: Bearish Trend Continuation — The gap-down breakdown continues, with sellers defending EMA 13 and VWAP on any bounce. MACD and −DI stay strong, and price tests the lower Bollinger Band and extends toward the SMA 200D. Trigger: a break and hourly close below $42.76 (lower BB). Target: $42.00 to $41.50 (SMA 200D region). Invalidation: a close above $44.25 (EMA 13). (50% probability)
- Scenario 2: Bullish Oversold Relief Bounce — RSI near 30 and price near the lower band draw dip buyers. Price rebounds toward VWAP, EMA 13 and the gap area but remains below the falling EMAs. Trigger: a hold above $42.76 with a reclaim of $43.80. Target: $44.20 to $44.50. Invalidation: a break below $42.76. (32% probability)
- Scenario 3: Neutral Base Building — Price chops between $42.70 and $44.00 as selling momentum fades and the bounce stalls under EMA 13. Trigger: low-volume, narrow-range candles. Target: $43.00 to $43.70. Invalidation: a close outside $42.50-$44.30. (18% probability)
PRICE TARGETS
- Target Price: $42.70 (6-day horizon)
- Expected Range: $41.70 to $44.30 (width $2.60, about 6.0% of the current price, sized between a 2-3 day range and a 7-10 day range)
- Key Levels: Support at $41.48 (SMA 200D), Resistance at $44.23 (EMA 13)
OVERALL BIAS
OVERALL BIAS: BEARISH - Price gapped down on heavy volume with a bearish MACD cross, −DI (46.2) far above +DI (16.9), a rising ADX, and price below all short- and mid-term averages. The oversold RSI could bring a bounce, but the trend evidence favors a drift lower toward the SMA 200D area.
This is educational analysis and not financial advice.