SPY 4-day bearish forecast — Nov 1, 2026
- Bias: Bearish
- Timeframe: 4 days (made Nov 1, 2026, target date Nov 4, 2026)
- Price at analysis: $755.71
- Price target: $751.00
- Expected range: $738.00 – $767.00
- Result: Incorrect (+1.5%) — closed at $767.37 on Nov 4, 2026; quality score 49/100
Get a free AI analysis of SPY today
Analysis
TECHNICAL INDICATORS
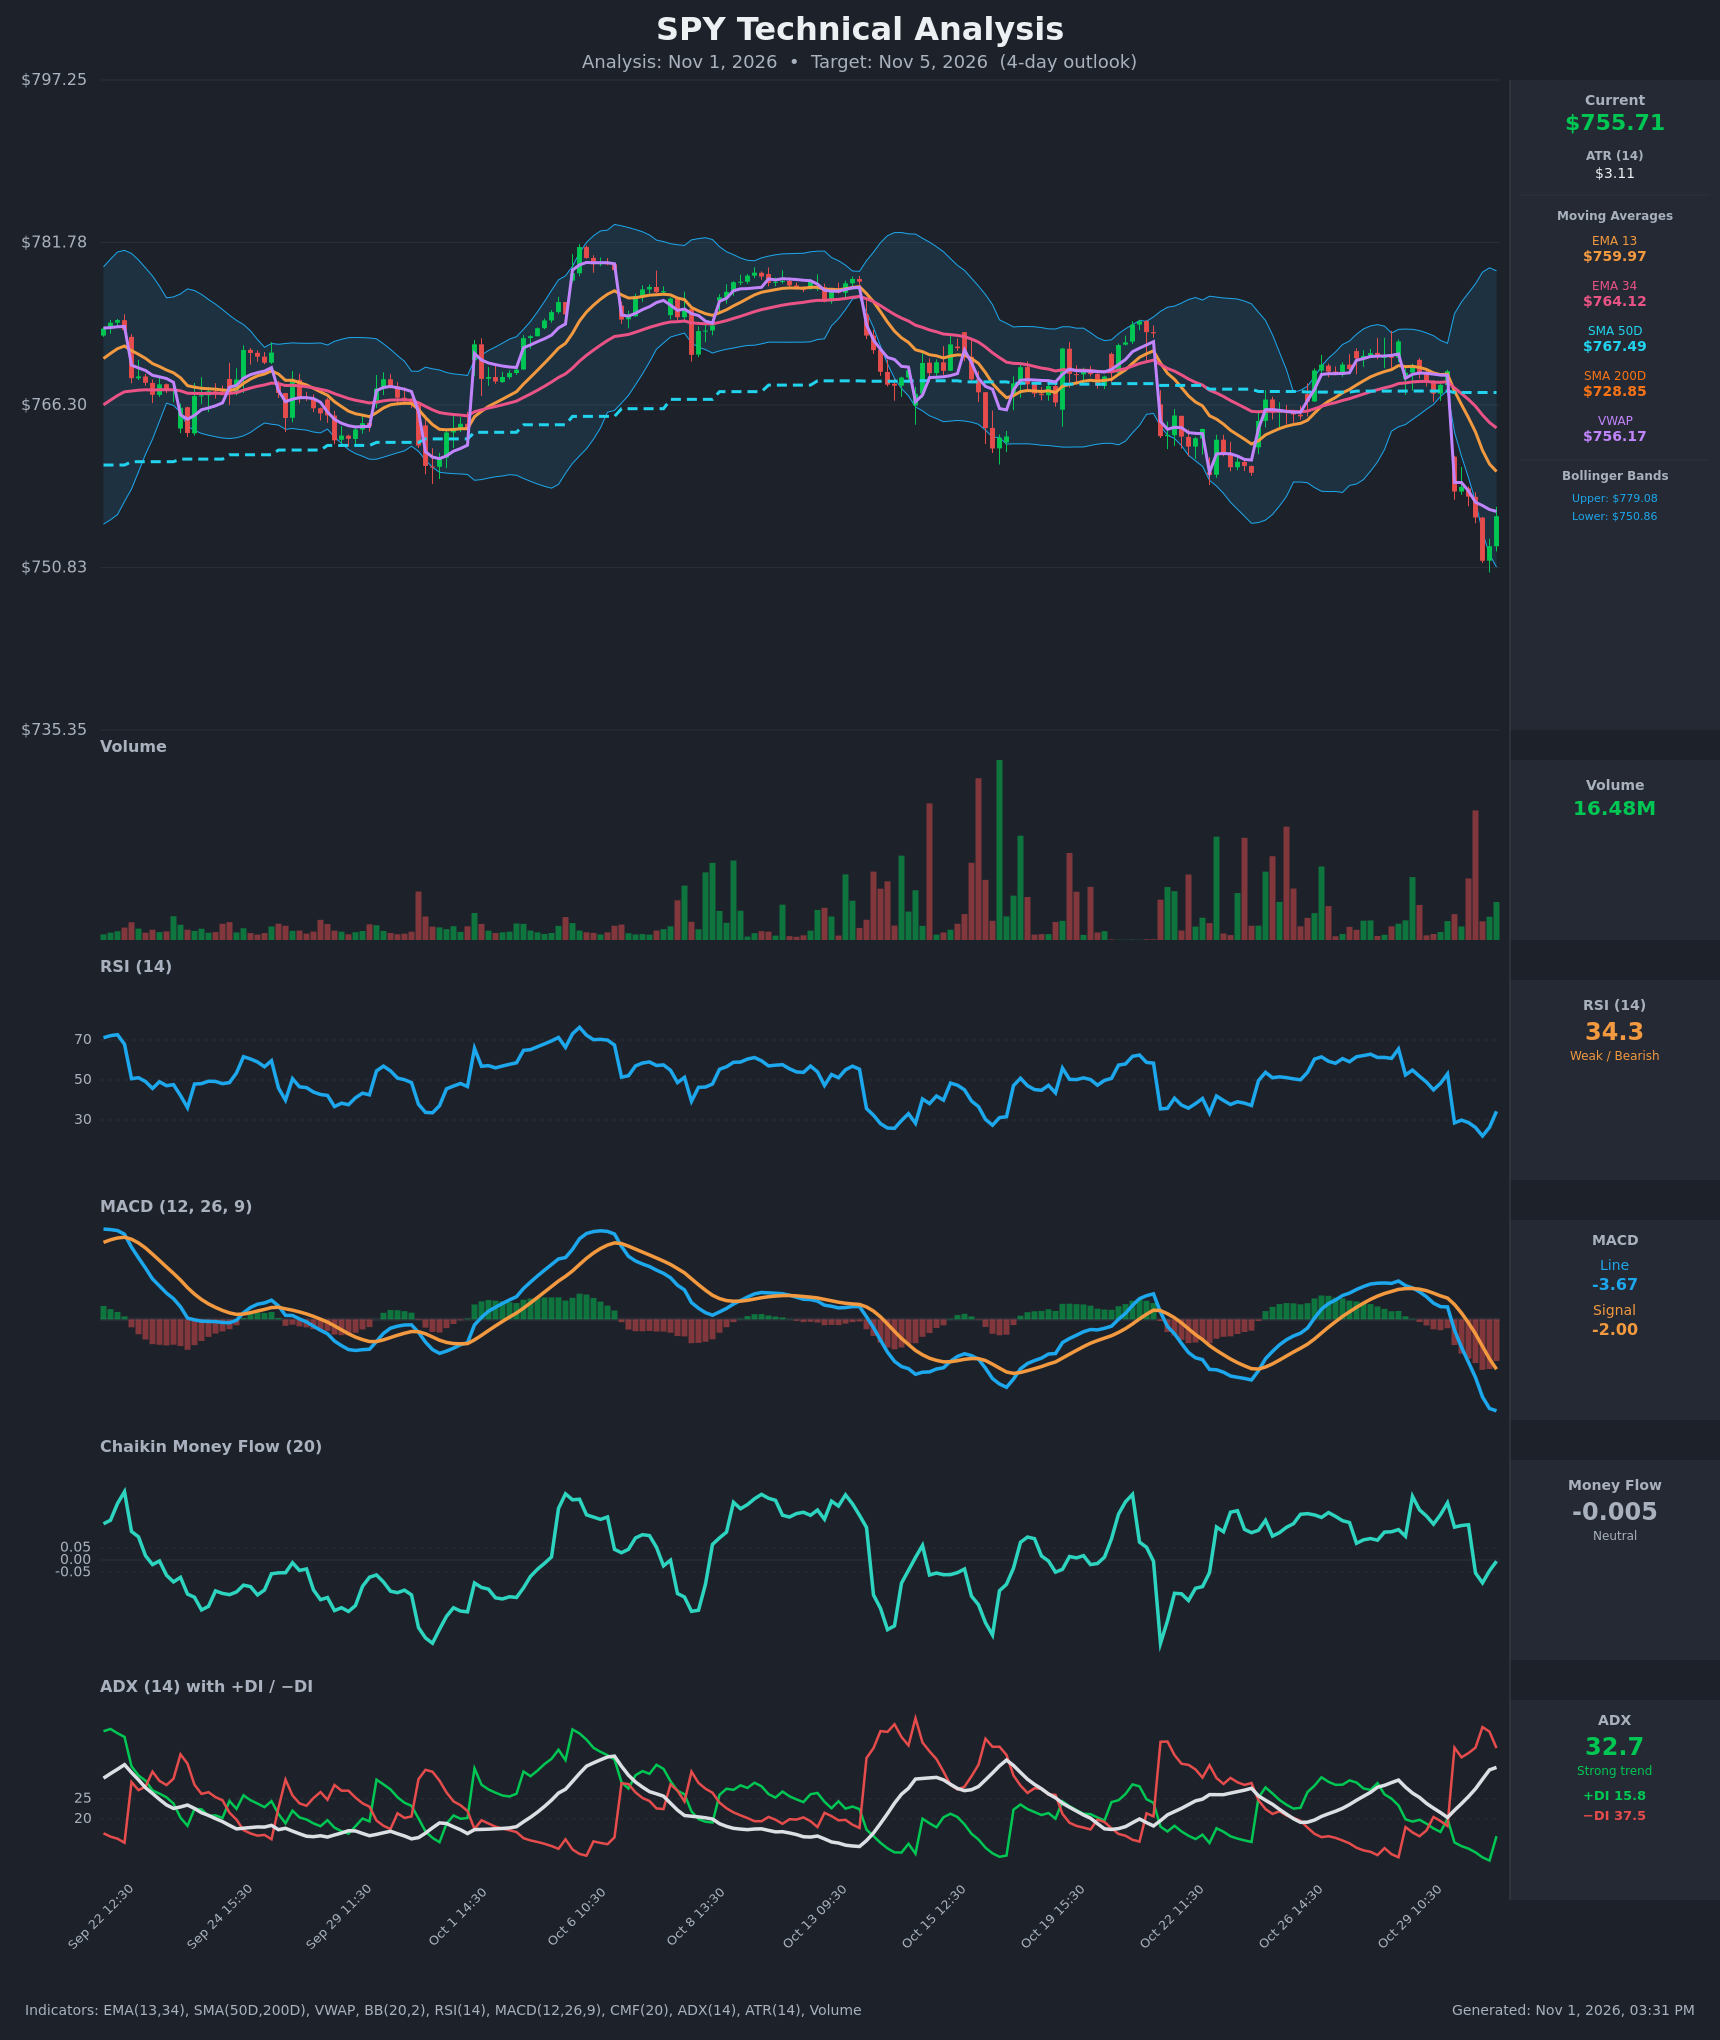
- RSI (14): 34.34, bouncing from a low near 22 at the Oct 30 13:30 bar. That low was deeply oversold, and the bounce is early. It is still below 40 and under the 50 midline, so momentum remains weak. [Bearish]
- 20 EMA: Only the EMA 13 ($759.97) and EMA 34 ($764.12) are provided. Price at $755.71 sits below both, and both are sloping down. The EMA 13 crossed below the EMA 34 on Oct 30 (it was $767.65 vs $767.93 at the 09:30 bar). The EMA 13 is the first resistance at about $760. [Bearish]
- MACD: Line at -3.67 is below the signal at -2.00. The bearish crossover happened Oct 30 around 11:30, and the histogram is negative and widening (about -1.67). The line is only starting to flatten, with no bullish turn yet. [Bearish]
- Bollinger Bands (20): Price at $755.71 is in the lower third of the bands ($750.86 lower, $779.08 upper). The bands are wide after the gap-down. The Oct 30 low pierced the lower band, so a mean-reversion bounce is possible, but trending moves can ride the lower band. [Neutral]
- CMF (20): -0.005, inside the neutral band. It fell from +0.14 to about zero during the sell-off, showing buying pressure fading but not yet distribution. [Neutral]
- ADX (14): 32.7 and rising, so the trend is strong. −DI (37.5) is far above +DI (15.8). +DI is ticking up from 9.7, a minor sign of selling exhaustion. [Strong Trend – Bearish]
- Volume: The latest bar is 16.48M, with a green candle. The chart shows a heavy red volume spike on the Oct 30 gap-down, so the breakdown was confirmed by volume. Volume on the current bounce is lighter, so the bounce lacks conviction. [Bearish on breakdown; weak bounce]
Moving average and VWAP context:
- Price is $0.46 below VWAP ($756.17), which acts as nearby resistance.
- Price is below the SMA 50D ($767.49) and well above the SMA 200D ($728.85). The long-term trend is up, but the short-term trend is down.
- No golden cross or death cross is in play, since the SMA 50D remains well above the SMA 200D.
DIVERGENCES & TRENDS
- There is no clear bullish divergence on RSI or MACD. RSI made a low of about 22 on the Oct 30 drop, versus roughly 28 on the earlier Oct 14–15 sell-off. That is a lower low in RSI against a lower price low, so there is no divergence.
- The RSI low is a mild oversold-bounce signal only. RSI turned up from 22 to 34 while MACD is still falling.
- The MACD bearish crossover on Oct 30 and the EMA 13/34 bearish cross confirm the short-term trend shift.
- The ADX is rising above 30 with −DI dominant. This is a strong-trend reading, and these usually resolve with continuation or a shallow bounce, not an instant reversal.
- +DI is curling up while −DI has dipped slightly from 42.7 to 37.5. This is an early sign of a relief bounce but not a DI crossover.
- CMF slipped from clearly positive to flat, confirming that buying pressure has dried up.
CHART PATTERNS
- The price had been consolidating in a $765–$772 range (Oct 22–29), then broke down with a gap on heavy volume. This resembles a Bearish Double Top / range breakdown from the reference diagram, with the neckline near $765–$767 now acting as resistance.
- The current small bounce from $750.5 into $755.7 may be forming a Bearish Flag / Pennant (continuation). Confirmation would be a bounce capped near $760–$762 followed by a break below $750.86.
- The measured-move target of the breakdown is roughly $745, if the range depth is projected from the breakdown level. The SMA 200D at about $728.85 is a deeper target and unlikely within 4 days.
- The pattern read is tentative. There is no textbook formation, and the gap-down dominates the picture.
POTENTIAL SCENARIOS
- Scenario 1: Bearish Flag Rejection and Continuation Lower — Price bounces toward the EMA 13/VWAP area, fails below the broken support, and resumes the downtrend with −DI dominance and a negative MACD. Trigger: rejection at $759–$762, then a break below $750.86. Target: $745–$748, with an extension to about $740. Invalidation: a close above $764 (EMA 34). (45% probability)
- Scenario 2: Bullish Oversold Relief Bounce — RSI exits oversold territory and price mean-reverts from the lower Bollinger Band, filling part of the gap. Trigger: a hold above $753 and a reclaim of VWAP/EMA 13 at about $760. Target: $764–$767 (EMA 34 and the SMA 50D). Invalidation: a break below $750 on volume. (35% probability)
- Scenario 3: Neutral Choppy Basing — Price stalls between the lower band and the EMA 13 while the ADX cools. Trigger: failure of both breakout levels, with the range holding. Target: $752–$760. Invalidation: a break outside $750 or $762. (20% probability)
PRICE TARGETS
Timeframe: 4 days, which is between the 2–3 day and 7–10 day guidance, so a range of about 3.8% of price is used.
- Target Price: $751.00 (continuation of the downtrend after a likely partial bounce)
- Expected Range: $738.00 to $767.00 (width $29.00, about 3.8% of $755.71)
- Key Levels: Support at $750.86 (lower Bollinger Band and Oct 30 low area), Resistance at $759.97 (EMA 13)
OVERALL BIAS
OVERALL BIAS: BEARISH - The gap-down breakdown on heavy volume, ADX above 30 with −DI far above +DI, MACD below its signal and widening negative, and price below the EMA 13/34 and VWAP outweigh the early oversold bounce. A relief rally toward $760 is likely to meet resistance and fade.
This is educational analysis and not financial advice.