SPY 6-day bearish forecast — Nov 1, 2026
- Bias: Bearish
- Timeframe: 6 days (made Nov 1, 2026, target date Nov 6, 2026)
- Price at analysis: $755.71
- Price target: $750.50
- Expected range: $736.00 – $770.00
- Result: Correct (-2.6%) — closed at $736.34 on Nov 6, 2026; quality score 100/100
Get a free AI analysis of SPY today
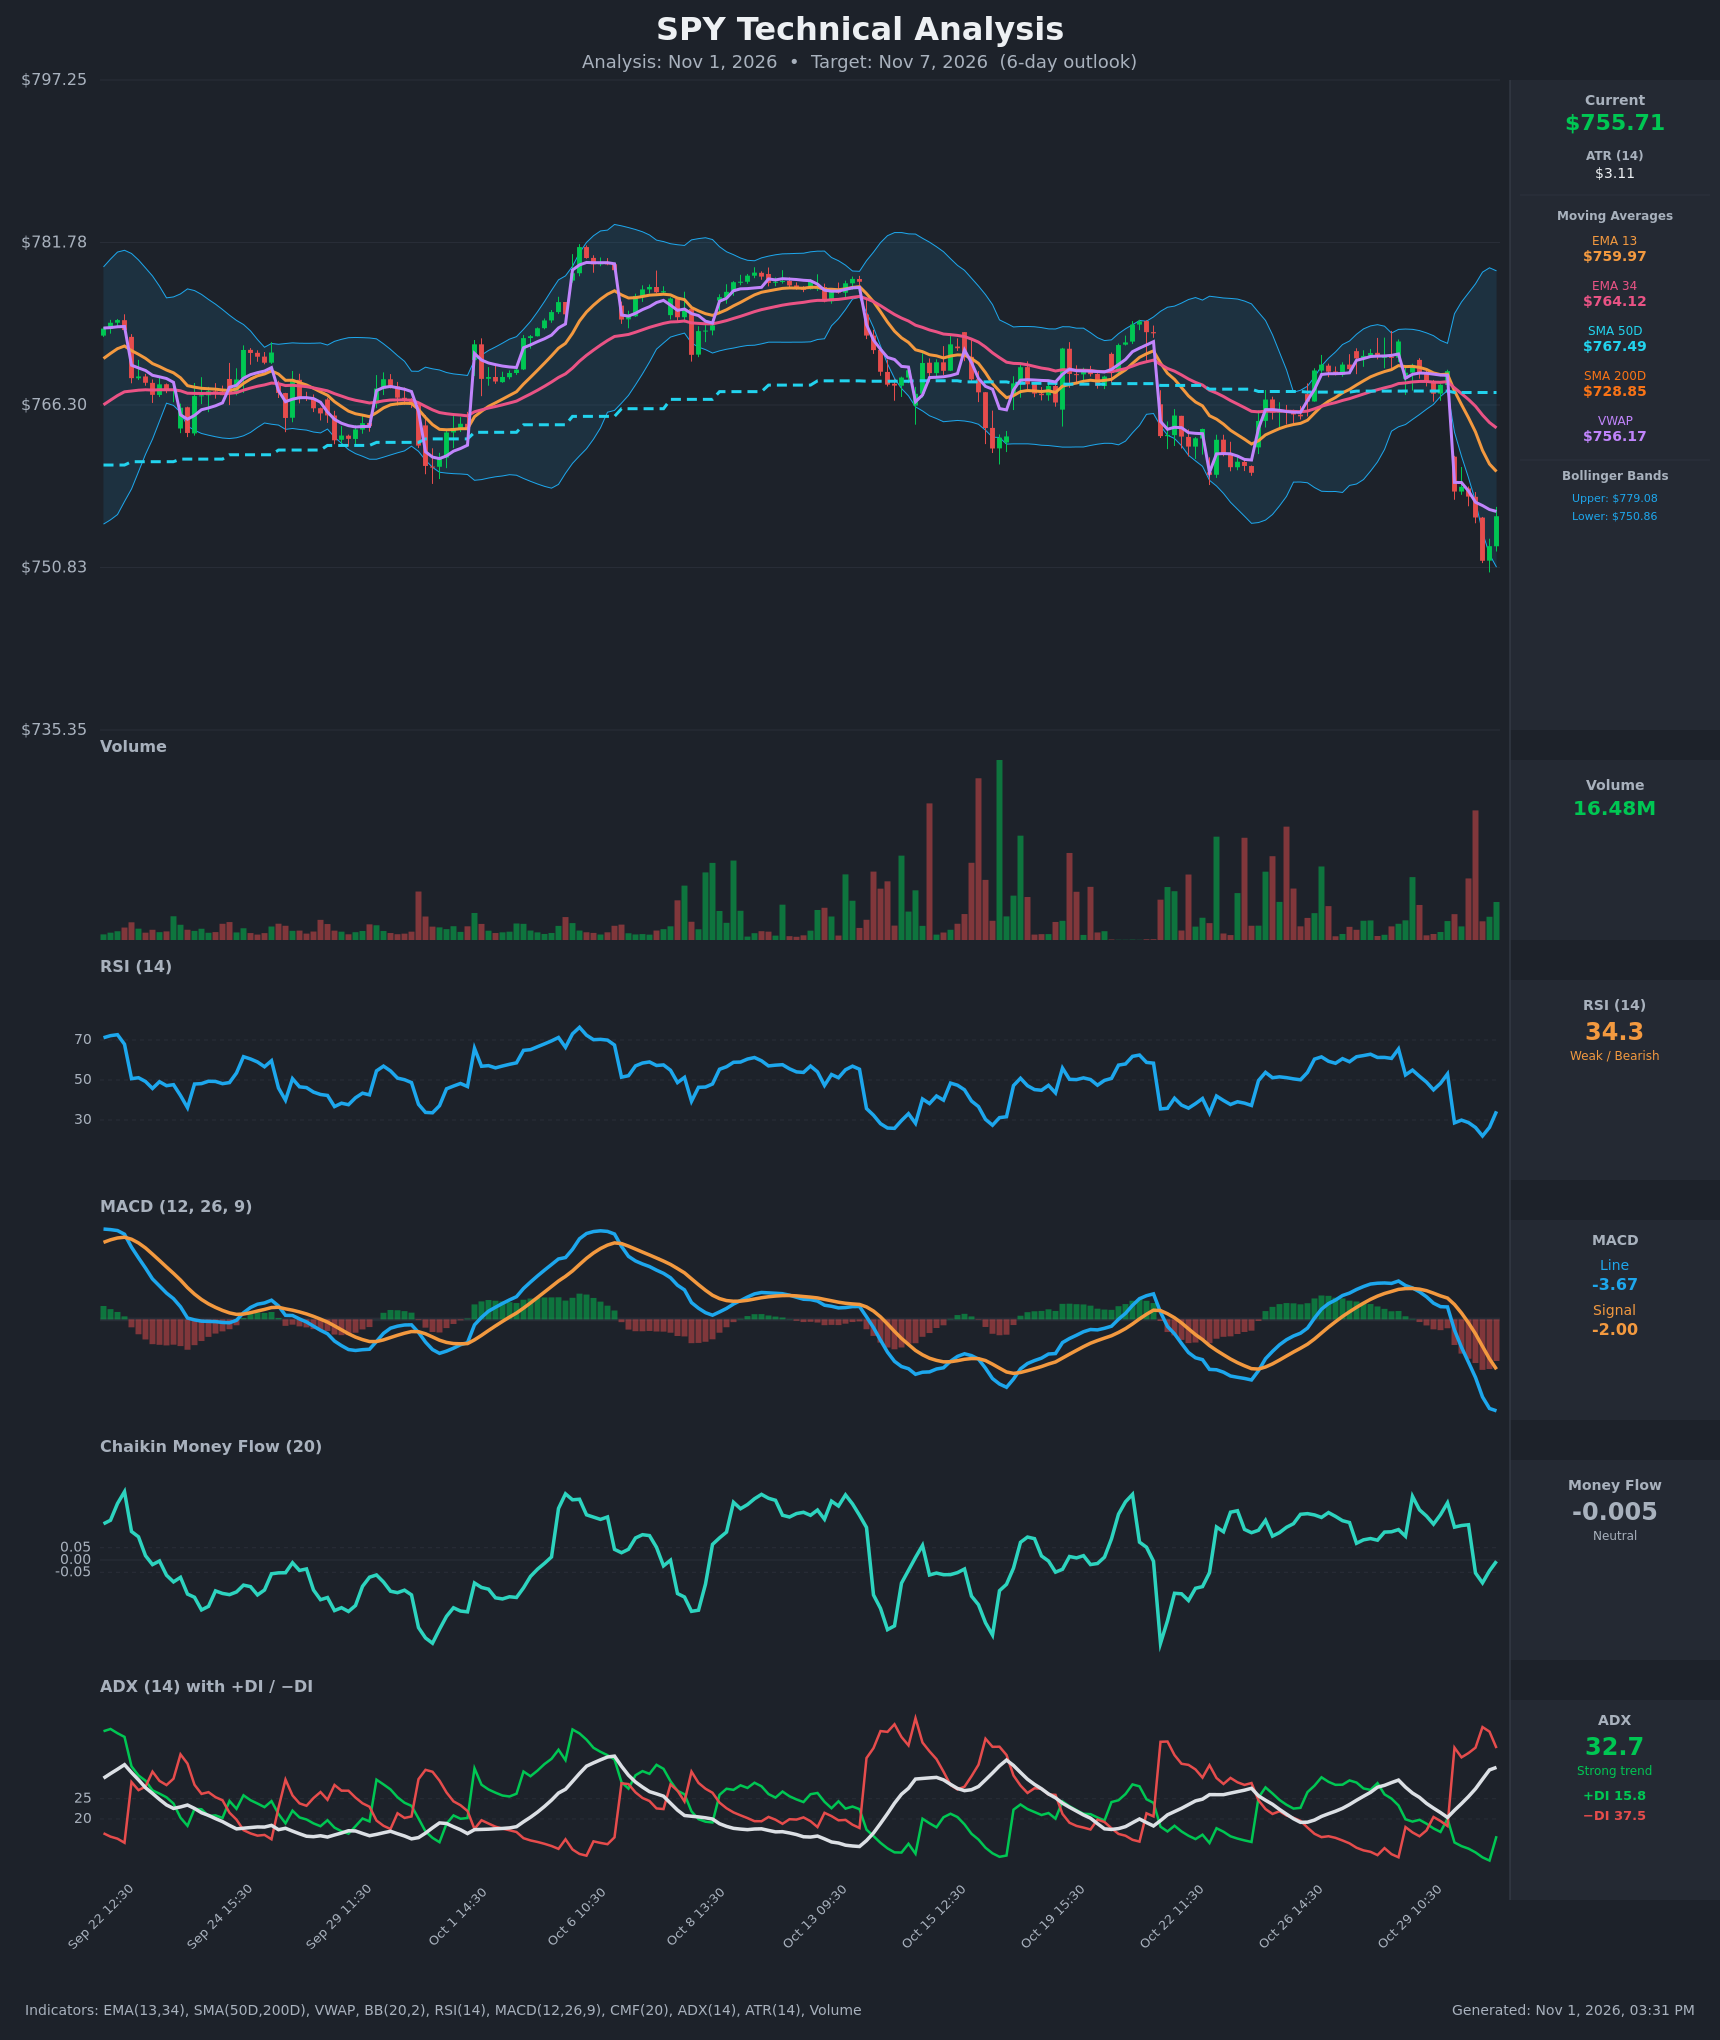
Analysis
TECHNICAL INDICATORS
- RSI (14): 34.34, rebounding from a deeply oversold 22.0 at the Oct 30 13:30 bar. It fell from 53 to 22 in about 5 hours, and the bounce is early and has not reclaimed 40. Momentum is still weak but washed out, which raises odds of a relief bounce. [Bearish]
- 20 EMA: The data gives EMA 13 at $759.97 and EMA 34 at $764.12, and price at $755.71 is below both. EMA13 crossed below EMA34 on Oct 30 at about 10:30 and the gap is widening. Both now act as resistance, with EMA13 nearest. [Bearish]
- MACD: Line -3.67 is below Signal -2.00, with a bearish crossover on Oct 30 11:30. The histogram is about -1.67 and still expanding negative, and the line is accelerating down with no sign of a turn. [Bearish]
- Bollinger Bands (20): Upper $779.08, lower $750.86, so price is near the lower band (about 17% of the band width). The bands are wide and expanding, so volatility is elevated. Price touched or pierced the lower band at roughly $751.47 and bounced. A band walk is possible in a strong trend, but a snap back toward the mid-band is also possible. [Neutral]
- CMF (20): -0.005, in the neutral zone (between -0.05 and +0.05). It slid from +0.23 to about zero, and briefly dipped to -0.09 during the selloff. Buying pressure has faded, but there is no outright distribution yet. [Neutral]
- ADX (14): 32.7 and rising from 20, so a strong trend is developing. −DI at 37.5 is far above +DI at 15.8, with a bearish DI crossover on Oct 30. +DI ticked up from 9.7 to 15.8 with the bounce. [Strong Trend – Bearish]
- Volume: 16.48M on the latest bar, moderate. The gap-down session carried heavy sell volume, visible as the large red spike near the right edge of the chart. The bounce bar has lighter volume, which suggests the rebound lacks strong conviction. VWAP at $756.17 sits just above price, a marginally bearish reading. [Selling pressure dominant, bounce on lighter volume]
DIVERGENCES & TRENDS
- Divergences: There is no clear bullish divergence yet. The RSI low (22) coincides with the price low ($751.47), and the MACD is still making new lows. A tentative early sign would be RSI lifting while price holds above $751, but this is not confirmed.
- Trends: The short-term trend turned down sharply with the Oct 30 gap from $769.53 to $758.06. EMA13 is below EMA34, both are below SMA50D ($767.49), and the SMA50D has started to roll over. Price is still well above the SMA200D ($728.85), so the long-term uptrend is intact and that average is a major downside magnet.
- Crossovers and breaks:
- Bearish MACD crossover.
- Bearish EMA13/EMA34 crossover.
- Bearish DI crossover with ADX above 30.
- Price broke below the SMA50D and below the prior range lows near $756–758.
- Price sits just below VWAP.
CHART PATTERNS
- Bearish Double Top (broad): Highs near $781 (Oct 6–7) and about $777 (Oct 13), then a lower high near $772 (Oct 28). The "neckline" support around $756–758 has now broken. The measured move (about $781 minus $756 = $25) projects toward $731, near the SMA200D at $728.85. A full measured move is unlikely within 6 days, but it frames the downside bias.
- Gap-down breakdown / range break: The Oct 30 gap-down candle sliced through consolidation support. Retests of the broken $758–764 area typically act as resistance, and that is where the 13 EMA and VWAP converge.
- No reliable bullish reversal pattern (double bottom, falling wedge) is visible yet.
POTENTIAL SCENARIOS
- Scenario 1: Bearish Trend Continuation — The bounce stalls at the EMA13/VWAP zone, sellers re-assert, and price retests the lower Bollinger Band and breaks it. ADX above 30 with −DI dominant favors follow-through. Trigger: rejection at $759–761 and a break below $750.86 on rising volume. Target: $745–749, with an extension to $738. Invalidation: a daily close above $764 (EMA34). (50% probability)
- Scenario 2: Bullish Oversold Relief Bounce — RSI has reset from 22 and price is at the lower band, so a mean-reversion rally toward the mid-band and the broken-support zone is plausible. Trigger: a hold above $751 and a reclaim of $760 (EMA13/VWAP). Target: $764–767 (EMA34/SMA50D). Invalidation: a break below $750 on volume. (32% probability)
- Scenario 3: Neutral Choppy Base — Price digests the drop between $751 and $762 as volatility cools. Trigger: failure to break either the lower band or EMA13. Target: $753–759. Invalidation: a decisive break of either side of the range. (18% probability)
PRICE TARGETS
- Target Price: $750.50 (6-day)
- Expected Range: $736.00 to $770.00 (width $34 ≈ 4.5% of current price, scaled for a 6-day horizon)
- Key Levels: Support at $750.86 (lower Bollinger Band), Resistance at $759.97 (EMA 13), with further resistance at $764.12 (EMA 34)
OVERALL BIAS
OVERALL BIAS: BEARISH - A gap-down breakdown with a bearish MACD crossover, −DI far above +DI with ADX at 32.7, and price below the EMAs and VWAP outweigh the oversold RSI bounce. Expect rallies to fade near $760–764, with downside pressure toward $750 and lower, though a relief bounce is a real risk.
This is educational analysis and not financial advice.