HOOD 6-day bearish forecast — Nov 1, 2026
- Bias: Bearish
- Timeframe: 6 days (made Nov 1, 2026, target date Nov 6, 2026)
- Price at analysis: $84.91
- Price target: $83.40
- Expected range: $80.90 – $86.60
- Result: Correct (-4.8%) — closed at $80.81 on Nov 6, 2026; quality score 95/100
Get a free AI analysis of HOOD today
Analysis
TECHNICAL INDICATORS
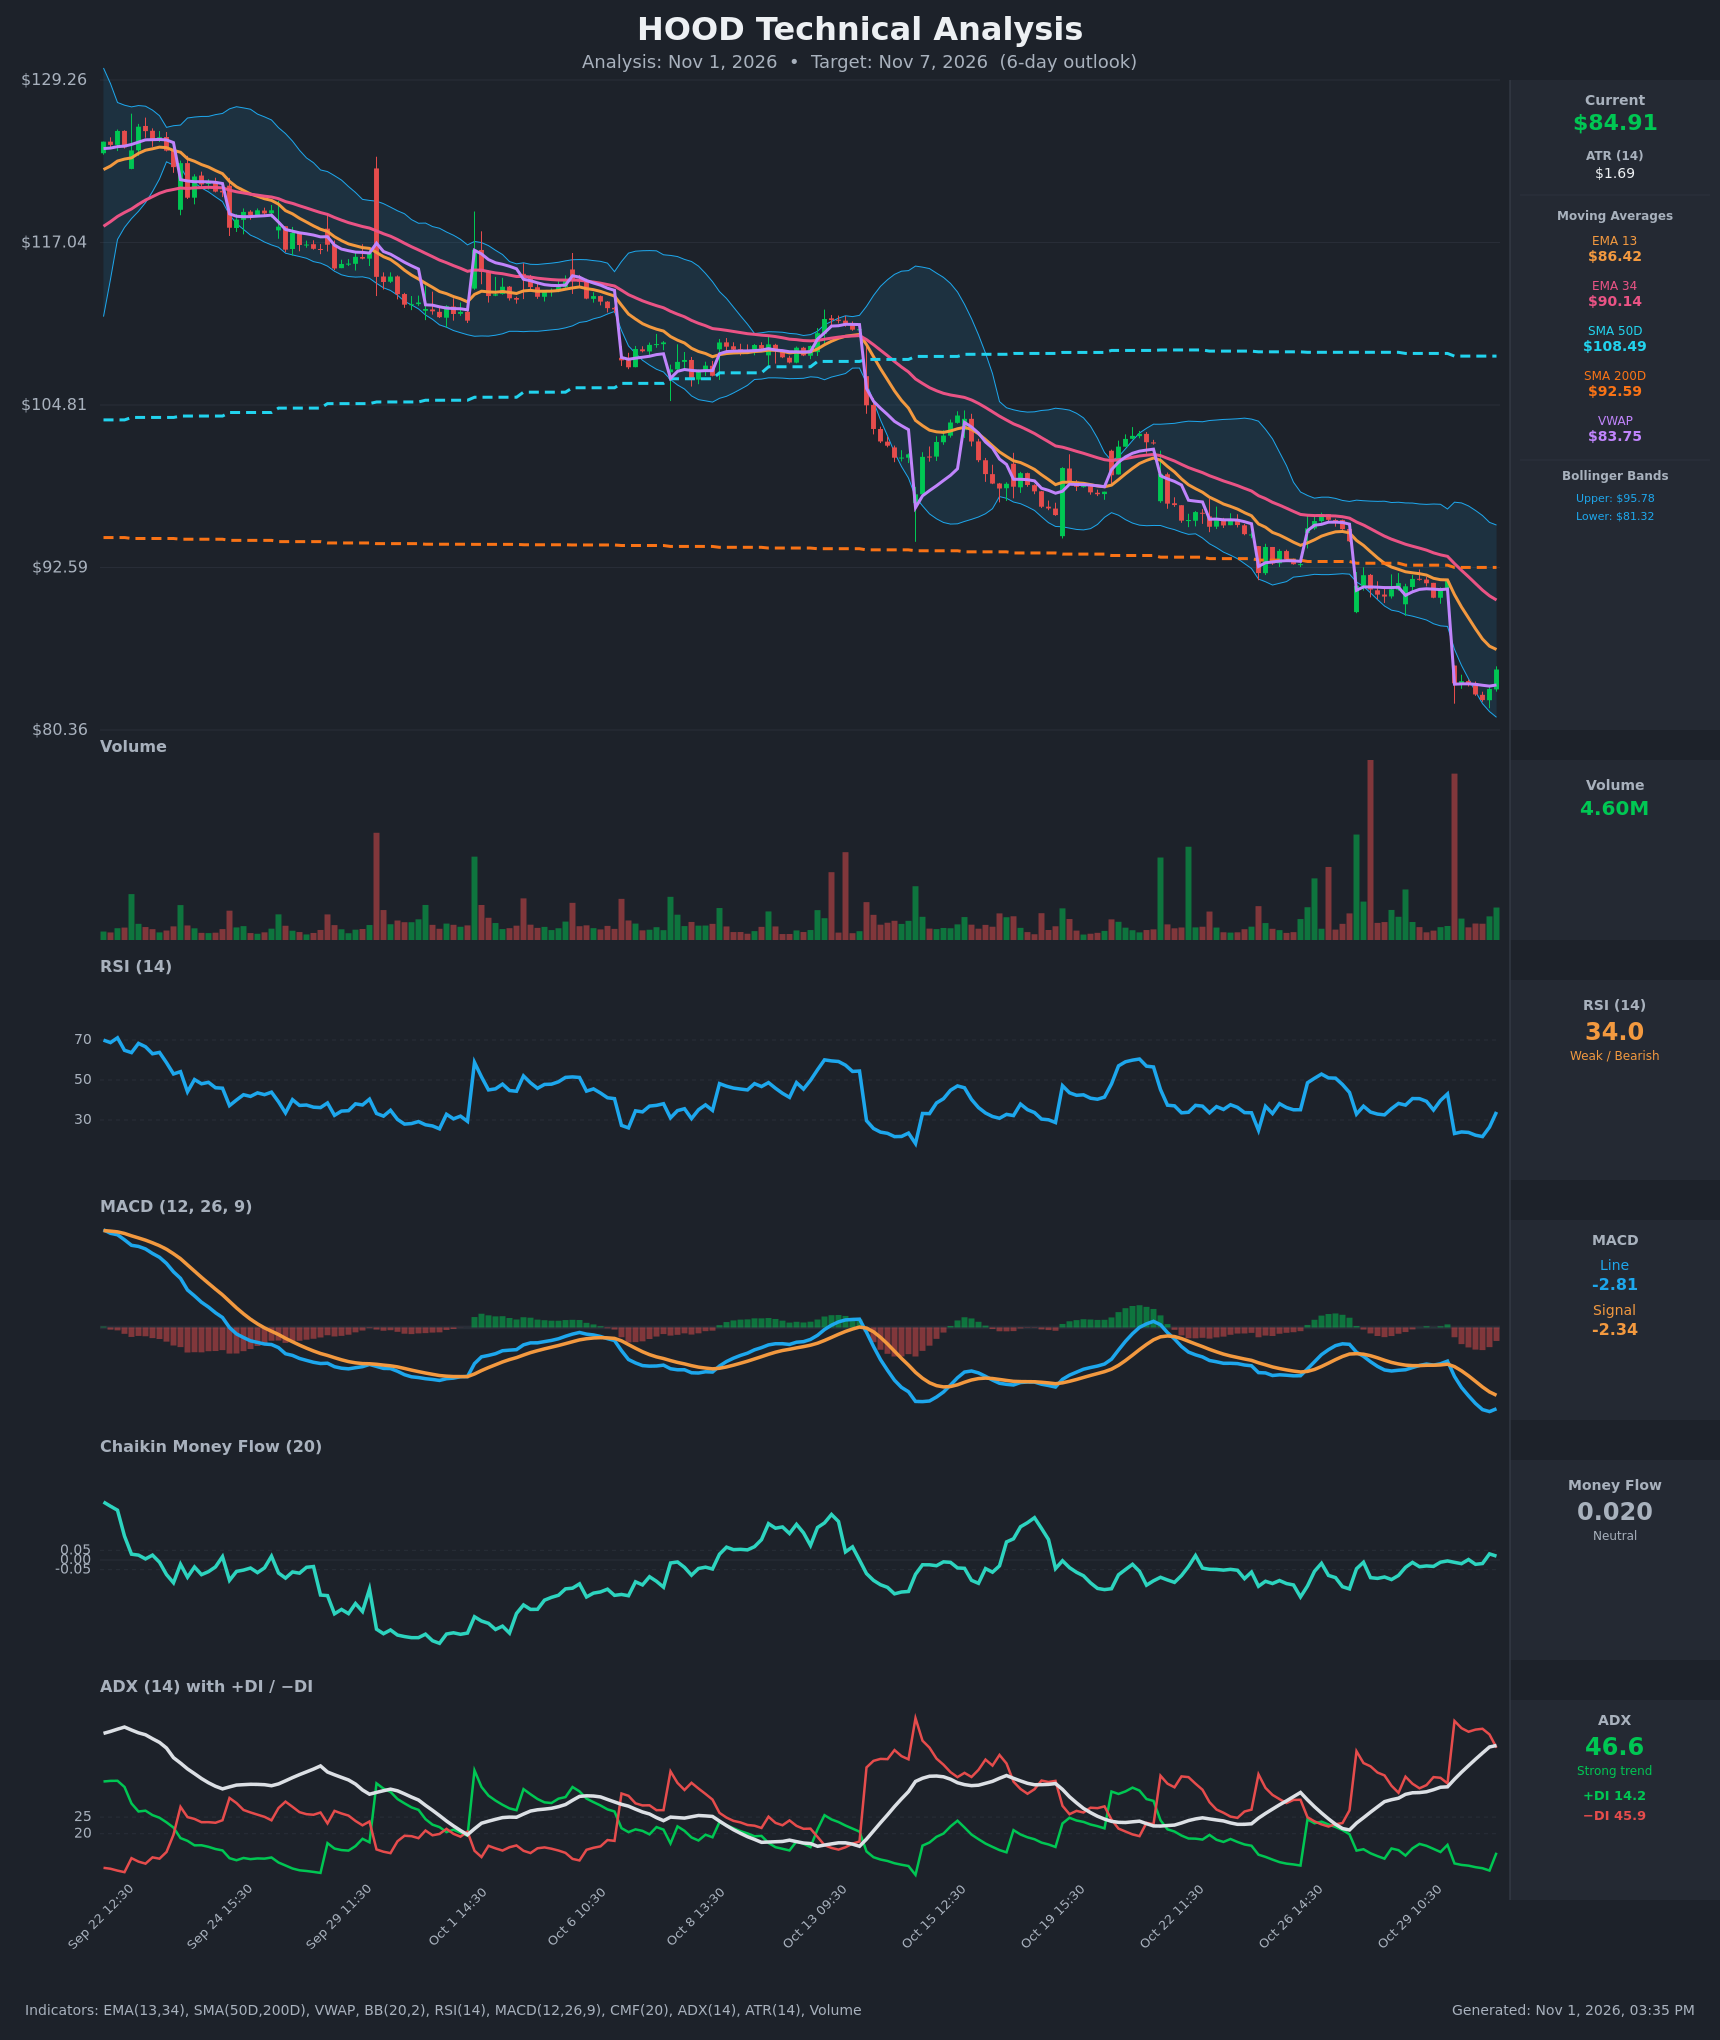
- RSI (14): 34.03, bouncing from a deeply oversold 21.7 on Oct 30 but still below 40 and under the 50 midline. The recovery is a relief bounce, not a momentum shift. [Neutral]
- 20 EMA: The data gives EMA 13 at $86.42 and EMA 34 at $90.14. Price ($84.91) is below both. EMA 13 is below EMA 34 and falling steeply, and EMA 13 is the first overhead resistance, about 1.8% above price. [Bearish]
- MACD: Line -2.81 is below signal -2.34, with a negative and widening histogram. The line did tick up slightly from -2.91, so downside momentum is flattening, but there is no bullish crossover. [Bearish]
- Bollinger Bands (20): Upper $95.78, lower $81.32, midline about $88.55. Price is in the lower third, just above the lower band, after riding it down. Bands are expanding after the gap, which fits a volatile downtrend. [Bearish]
- CMF (20): 0.020, within the neutral zone and hovering near zero. Selling pressure has not intensified, but there is no real accumulation either. [Neutral]
- ADX (14): 46.6 and rising, a very strong trend. −DI (45.9) is far above +DI (14.2), so bears are firmly in control. +DI ticked up from 8.9 to 14.2, a small sign of a bounce. [Strong Trend – Bearish]
- Volume: 4.60M on the latest bar, a green bar above the recent average, after a huge red capitulation-type spike on the Oct 30 gap. Price is above VWAP ($83.75), which suggests tentative dip buying. One bar is not enough to call a reversal. [Neutral / early relief bounce]
DIVERGENCES & TRENDS
- No confirmed bullish RSI divergence. Price made a lower low at about $82.61 while RSI set its low on the gap bar (21.7), so RSI is simply recovering from the extreme.
- MACD is still making lower lows and is not diverging.
- The trend is firmly down. Price is below the 13 EMA, 34 EMA and the 200D SMA ($92.59). The 50D SMA ($108.49) is far above and falling, heading toward a possible death cross with the 200D.
- The Oct 30 gap down from $91.56 to $83.87 (about -8%) is a major breakaway-style move. The unfilled gap and the $91+ area act as heavy overhead supply.
- ADX near 47 with −DI dominant is often seen late in a move. That raises the odds of a relief bounce but does not signal a reversal.
- There is no EMA 13/34 bullish crossover. MACD is below signal and the DIs have not crossed.
CHART PATTERNS
- There is no clean reversal pattern. The structure is a persistent descending channel of lower highs and lower lows.
- The small base after the gap could develop into a Bearish Flag / Pennant from the reference diagram. If the bounce stalls under EMA 13 (~$86.4) and breaks down, the measured move points to roughly $80 or lower, extending the gap-down leg.
- A bullish alternative is a short-term double-bottom-style basing near $82.6–$83. It needs a close above $86.4–$88.5 (EMA 13 and the Bollinger midline) to be credible, and nothing confirms it yet.
POTENTIAL SCENARIOS
- Scenario 1: Bearish Trend Continuation / Bear Flag Breakdown — The bounce stalls at EMA 13 and VWAP-area support fails, then price resumes the strong downtrend with −DI dominant and MACD widening negative. Trigger: rejection at $86.4 and a close below $83.75 (VWAP) and then $82.60. Target: $81.30 (lower Bollinger Band), with an extension to $80.4. Invalidation: daily close above $88.5. (47% probability)
- Scenario 2: Bullish Oversold Relief Bounce — RSI recovers from oversold, price holds above VWAP, and a short squeeze moves price up to the declining moving averages. Trigger: close above $86.42 (EMA 13) on rising volume. Target: $88.50 (Bollinger midline), possibly up to $90.1 (EMA 34). Invalidation: close back below $83.00. (38% probability)
- Scenario 3: Neutral Choppy Base — Price digests the gap in a tight range between $82.6 and $86.4 as ADX starts to roll over. Trigger: failure to break either $82.6 or $86.4. Target: $84–$85.5. Invalidation: a close outside the $82.6–$86.4 range. (15% probability)
PRICE TARGETS
- Target Price: $83.40 (6-day horizon, about -1.8% from $84.91)
- Expected Range: $80.90 to $86.60 (width $5.70, about 6.7% of current price, consistent with the 7-10 day band scaled down for 6 days)
- Key Levels: Support at $82.60 (Oct 30 low area, with the lower Bollinger Band at $81.32 below it), Resistance at $86.42 (EMA 13, then $88.55 Bollinger midline)
OVERALL BIAS
OVERALL BIAS: BEARISH - Very strong downtrend (ADX 46.6, −DI 45.9 vs +DI 14.2) with price below all key moving averages and MACD below its signal. Any oversold bounce (RSI 34) is likely to meet resistance at EMA 13 ($86.42). The bearish edge is modest because of the oversold bounce, price above VWAP and neutral CMF.
This is educational analysis and not financial advice.