HOOD 48-day bearish forecast — Nov 15, 2026
- Bias: Bearish
- Timeframe: 48 days (made Nov 15, 2026, target date Jan 1, 2027)
- Price at analysis: $77.86
- Price target: $74.00
- Expected range: $64.00 – $86.00
- Result: Pending — graded after the close on Jan 1, 2027
Get a free AI analysis of HOOD today
Analysis
TECHNICAL INDICATORS
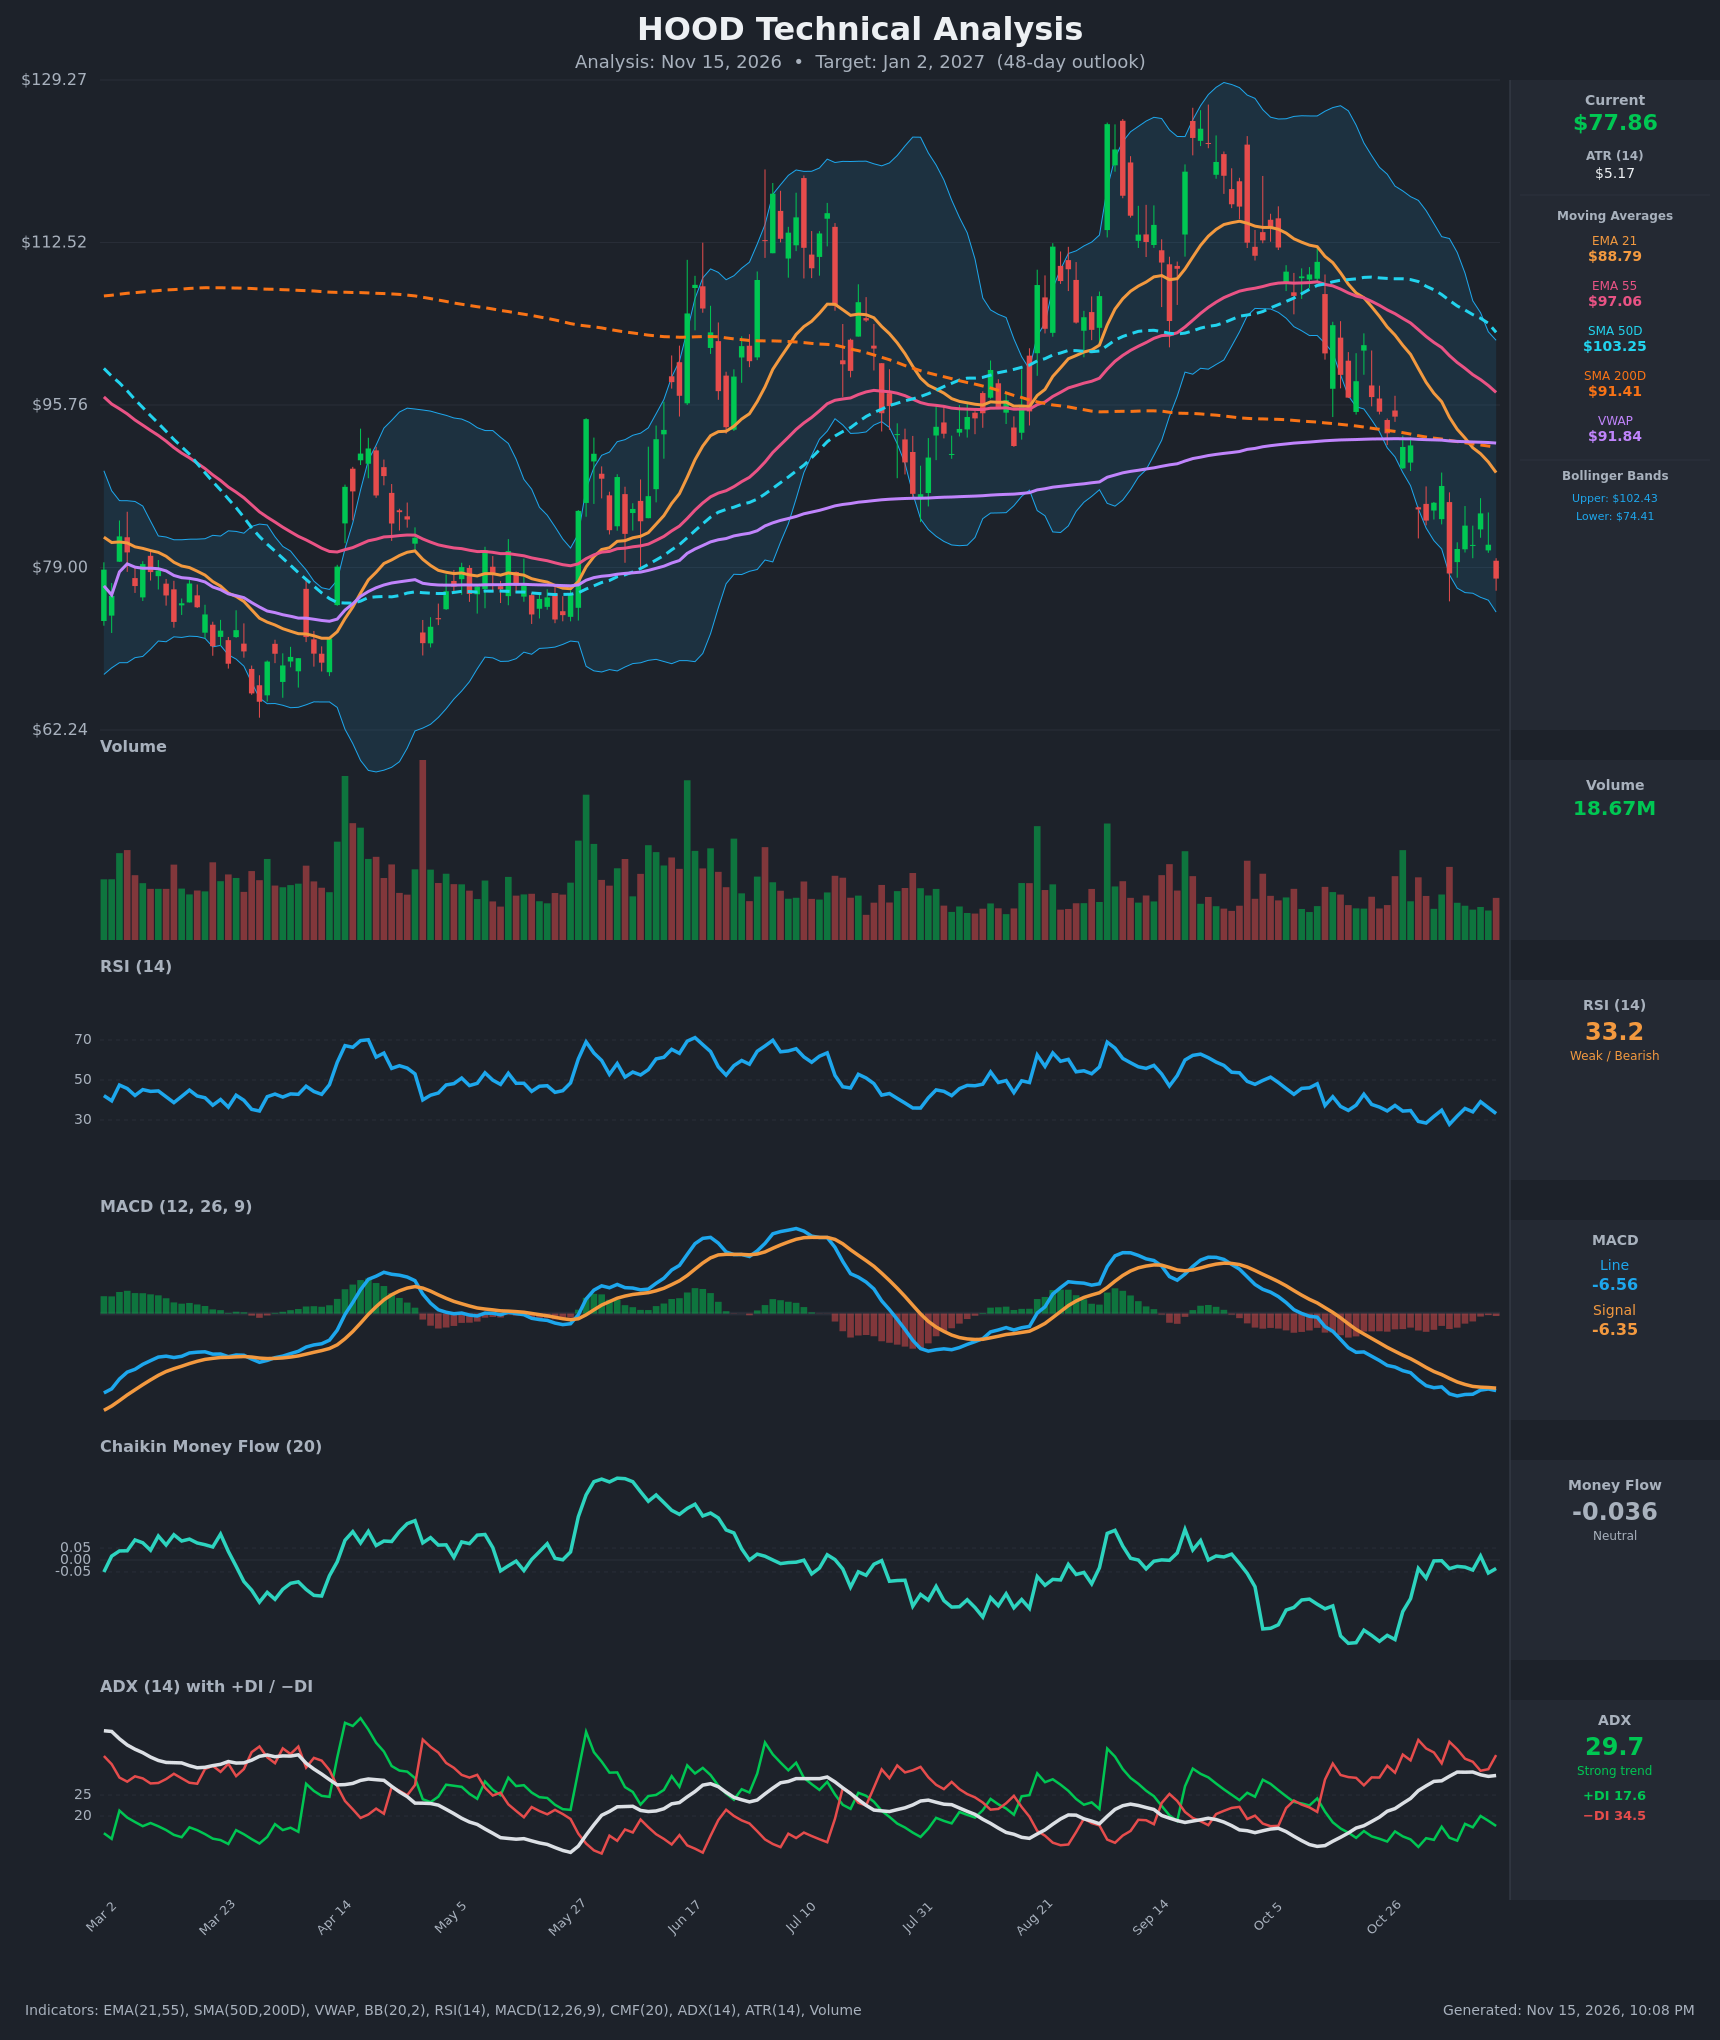
- RSI (14): 33.23, near oversold but not below 30. It has made lower lows through the decline (Oct 30 at 29.3 and Nov 5 at 27.8), and rallies keep failing in the mid-30s. Momentum is weak and still pointing down. [Bearish]
- 20 EMA (EMA 21): $88.79, with price at $77.86, about 12% below it. The EMA is falling steadily, from $103.81 to $88.79 in 15 bars, so it acts as dynamic resistance. EMA 21 is also well below EMA 55 ($97.06), a bearish stack. [Bearish]
- MACD: Line -6.56, signal -6.35, histogram slightly negative (about -0.21). The line has just crossed back below the signal after nearly converging on Nov 11-12. It is deeply negative with no bullish crossover yet. [Bearish]
- Bollinger Bands (20): Upper $102.43, lower $74.41, so price sits in the lower part of the band, about 12% of the band width above the lower band. The bands are wide after the sell-off. Price has been riding the lower half and the lower band is the nearest test. [Bearish]
- CMF (20): -0.036, inside the neutral zone (±0.05). It has recovered from about -0.33 in late October but has stalled around zero. Selling pressure has eased, with no accumulation yet. [Neutral]
- ADX (14): 29.7 with −DI at 34.5 and +DI at 17.6. This is a strong trend, and the bears are clearly in control (−DI roughly double +DI). ADX has been rising since the low 20s. [Strong Trend – Bearish]
- Volume: 18.67M, modest and close to average. Volume has not spiked into the lows, so there is no capitulation signal. Red days have carried slightly more weight during the breakdown. [Neutral to mildly bearish, no capitulation]
DIVERGENCES & TRENDS
- Divergences: There is no clear bullish divergence. RSI made a lower low on Nov 5 (27.8) versus Oct 30 (29.3), and price also made lower lows, which confirms the trend rather than diverging. CMF has improved from -0.33 to about -0.04 while price fell, a mild positive divergence in money flow that suggests selling pressure is fading.
- Moving averages: Price is below EMA21, EMA55, SMA50D ($103.25), SMA200D ($91.41) and VWAP ($91.84). EMA21 crossed below EMA55 in late October, and the SMA50D is rolling over and heading toward the SMA200D. A death cross (SMA50D below SMA200D) is likely within weeks if the decline continues.
- MACD: The bearish momentum is deep, but the line has been hovering at the signal, which points to a possible stall or relief bounce.
- Trend: The structure is lower highs and lower lows since the ~$129 peak. Price is now back near the $75–79 region that acted as support in March–May.
CHART PATTERNS
- Bearish Head and Shoulders / Double Top (reversal): The July and September peaks near $120–129 with a lower, rounded recovery in between look like a double top. The neckline near $79–95 has been broken, and the measured move points toward the $65–70 area, close to the March low (about $62–65).
- Possible bullish Double Bottom: If price holds around $74–77 (the lower band and the prior support zone), it could form a double bottom against the March-April lows. This is not confirmed and would need a break above the recent swing highs around $84–88.
- Significance: The bearish double top has played out and the trend is strong. The prior support zone ($70–78) is the key area that decides whether a larger bounce or a further breakdown follows.
POTENTIAL SCENARIOS
- Scenario 1: Bearish Trend Continuation — The −DI-led trend persists, price breaks below the lower Bollinger Band ($74.41) and the SMA50D rolls under the SMA200D for a death cross. Price tests the March–May support zone. Trigger: daily close below $74.40. Target: $66–70. Invalidation: daily close above $88.80 (EMA21). (45% probability)
- Scenario 2: Bearish-Leaning Range / Weak Bounce — Price stabilises in the $72–85 zone as RSI resets and CMF stays near zero, bounces to resistance at the falling EMA21 and fails there. Trigger: hold of $74 and a bounce toward $84. Target: $74–80 at the end of the window. Invalidation: close above $88.80. (30% probability)
- Scenario 3: Bullish Mean-Reversion Rally — Oversold conditions and the double-bottom setup at prior support trigger a relief rally toward the VWAP and SMA200D. Trigger: close above $85 with a bullish MACD crossover and RSI above 45. Target: $91–92 (VWAP / SMA200D). Invalidation: close below $72. (25% probability)
PRICE TARGETS
- Target Price: $74.00 (48 days, Jan 2, 2027)
- Expected Range: $64.00 to $86.00 (width $22 = about 28% of current price, matching the 18–30% guidance for 61–180 days and slightly wider than the 30–60 day guidance given the ATR of $5.17 and a strong trend)
- Key Levels: Support at $74.41 (lower Bollinger Band), then $66.00; Resistance at $88.79 (EMA21), with $84.58 as the first minor resistance
OVERALL BIAS
OVERALL BIAS: BEARISH - Price sits below every moving average and VWAP, −DI (34.5) dominates +DI (17.6) with ADX at 29.7, MACD is deeply negative, and RSI keeps making lower lows. The oversold bounce potential and easing CMF limit the downside to the prior $64–70 support area.
This is educational analysis and not financial advice.