HOOD 34-day bearish forecast — Nov 15, 2026
- Bias: Bearish
- Timeframe: 34 days (made Nov 15, 2026, target date Dec 18, 2026)
- Price at analysis: $77.86
- Price target: $73.50
- Expected range: $62.50 – $84.50
- Result: Pending — graded after the close on Dec 18, 2026
Get a free AI analysis of HOOD today
Analysis
TECHNICAL INDICATORS
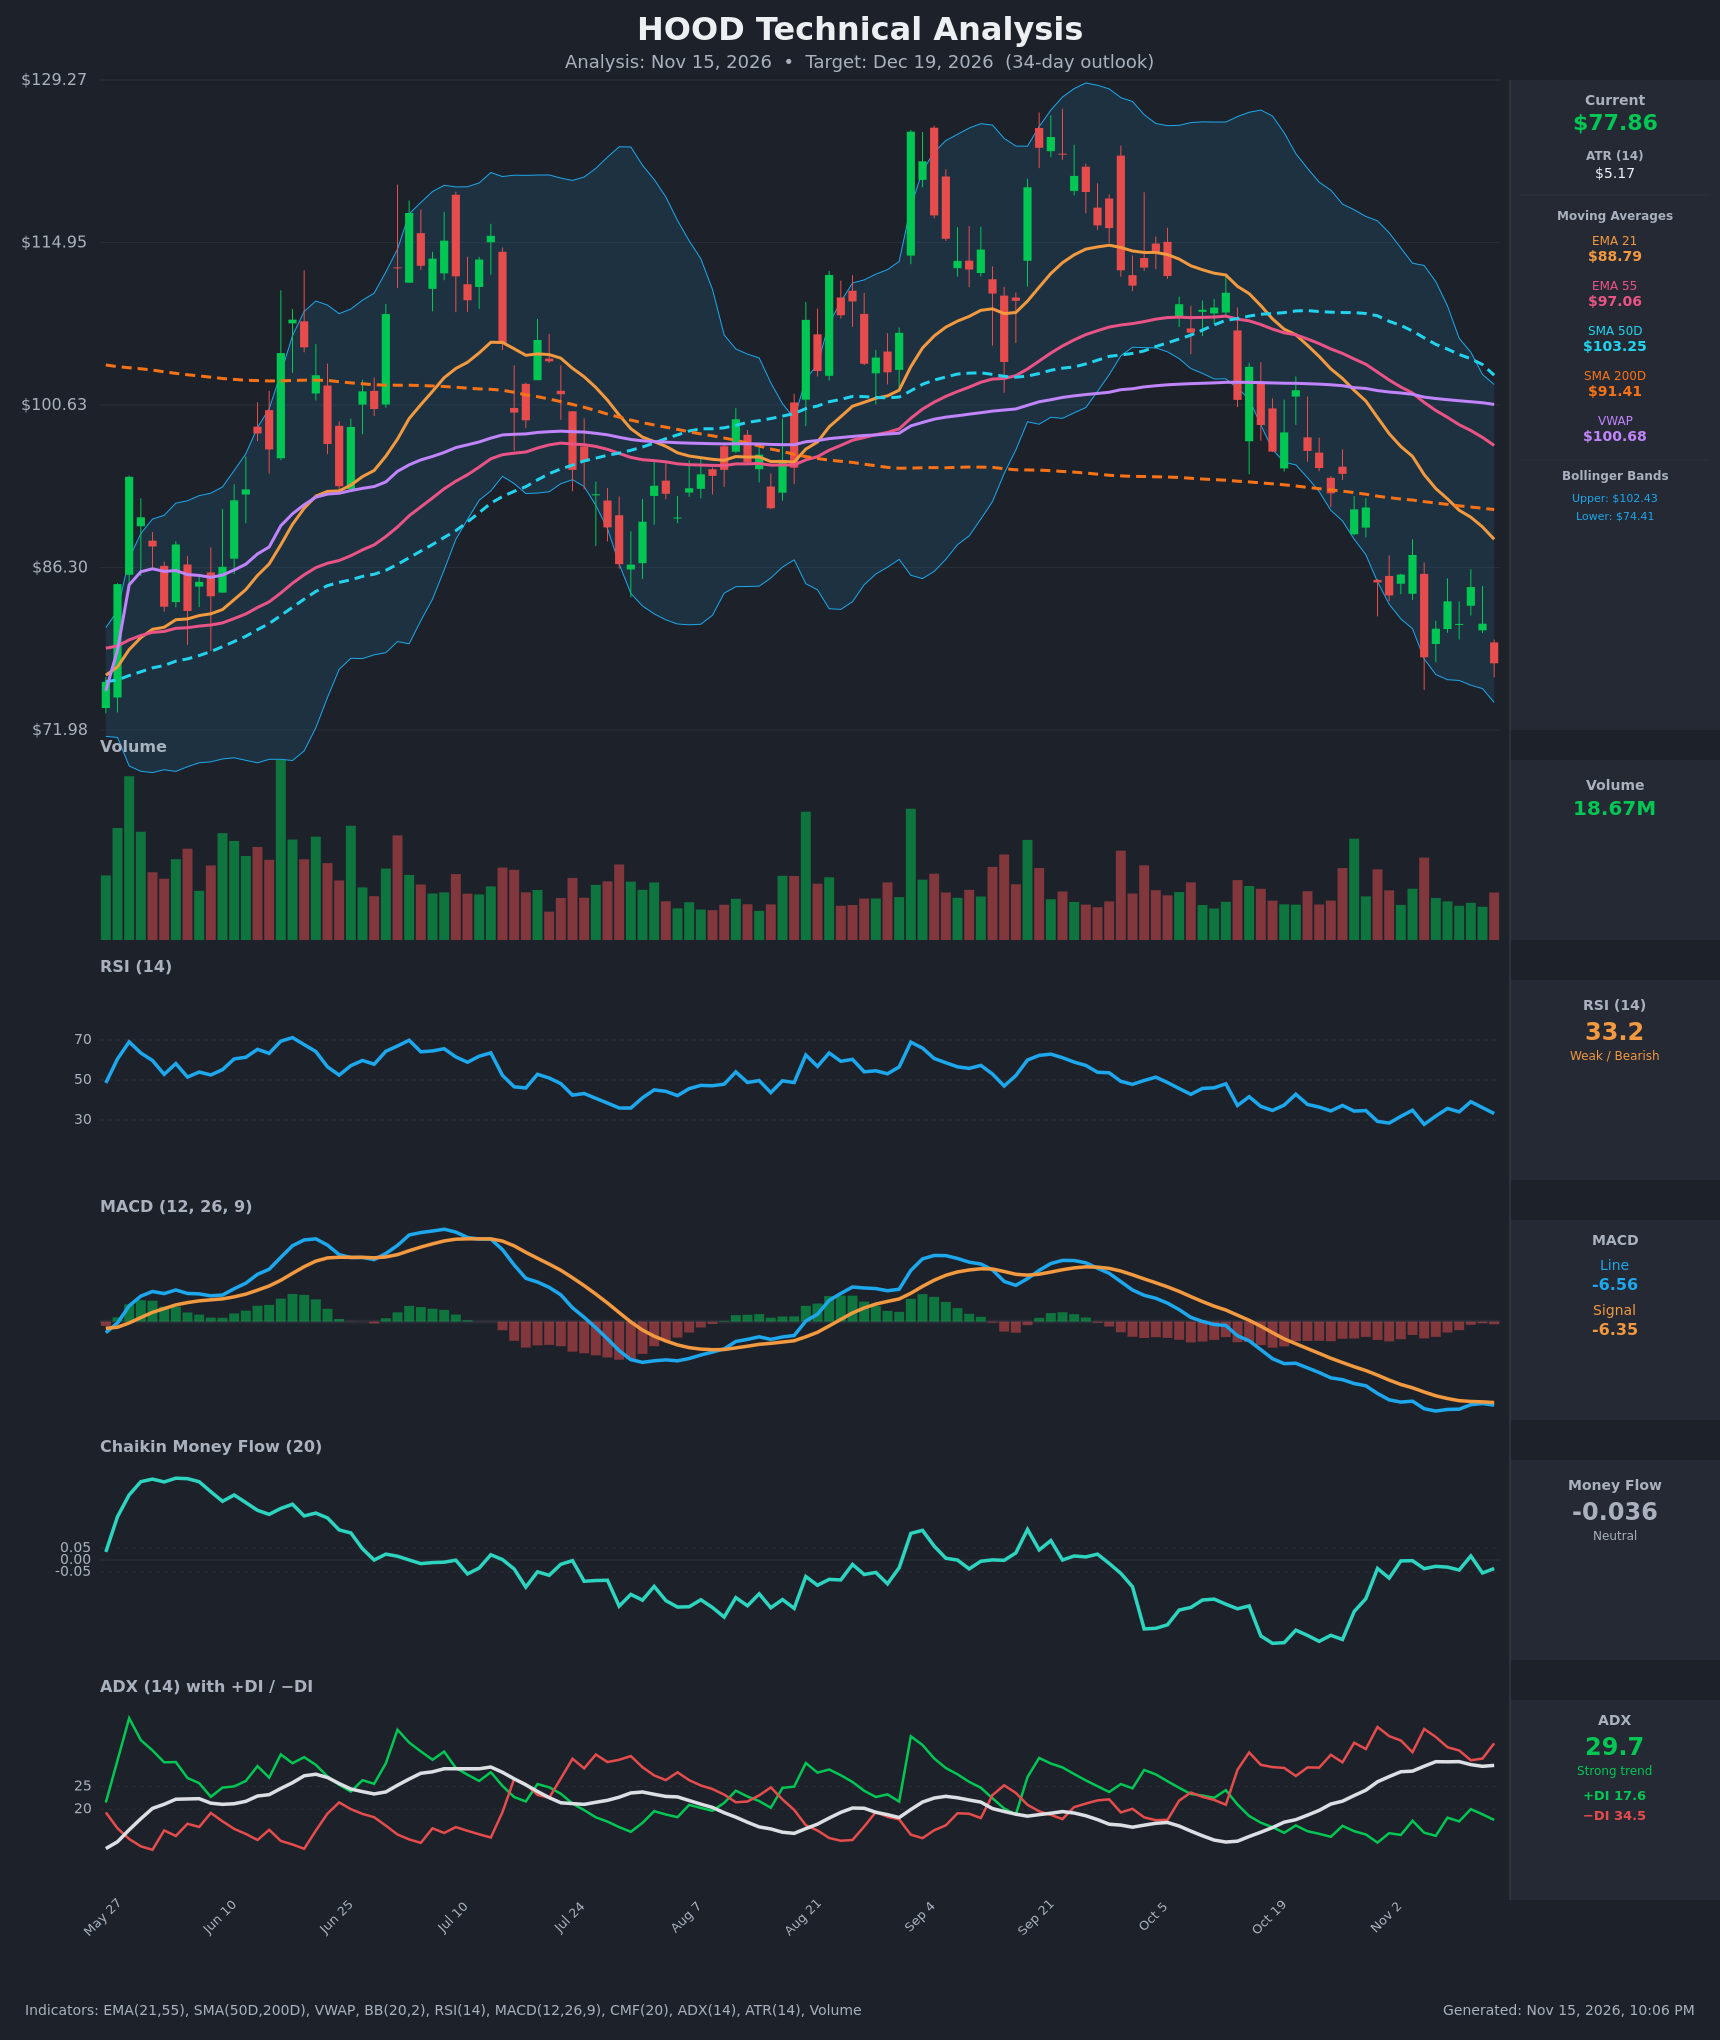
- RSI (14): 33.23, just above oversold (<30). It has stayed in the 28-39 range for about two weeks, with lower highs since September. It touched 27.8 on Nov 5 and bounced weakly. Momentum is bearish but stretched, and no bullish divergence has formed yet. [Bearish]
- 20 EMA (EMA 21): $88.79. Price at $77.86 is about 12% below it, and the EMA is falling steeply (from $103.81 on Oct 26), so it acts as overhead resistance. EMA21 is also well below EMA55 ($97.06), and that bearish alignment has widened. [Bearish]
- MACD: Line -6.56 against signal -6.35, so the line is below the signal and the histogram is slightly negative at about -0.21. The two lines converged on Nov 11-12 and have since rolled over slightly. Both are deeply negative and flattening, which suggests downside momentum is decelerating but there is no bullish crossover. [Bearish]
- Bollinger Bands (20): Upper $102.43, lower $74.41, midline about $88.4. Price is in the lower third, about 3.5 points above the lower band. Price has been walking the lower half of the bands since late October, and the bands are wide. This is a bearish trend, though a lower-band test is near. [Bearish]
- CMF (20): -0.036, in the neutral zone (between -0.05 and +0.05). It has recovered from about -0.32 in late October, so selling pressure has eased, but it is not showing accumulation. It also hovers around zero while price makes new lows, a mild positive divergence. [Neutral]
- ADX (14): 29.7 and rising, with −DI at 34.5 well above +DI at 17.6. This is a strong, established downtrend with bears firmly in control. The DI spread is wide, though +DI has bounced off its lows. [Strong Trend - Bearish]
- Volume: 18.67M on the last bar, in line with or slightly below the recent average. The recent selloff came with spikes on the red candles (Oct 30, Nov 5), while the bounces came on lighter volume. There is no capitulation volume yet. [Bearish - weak bounces, no capitulation]
DIVERGENCES & TRENDS
- Moving averages: Price is below EMA21, EMA55, SMA50D ($103.25), VWAP ($100.68) and now SMA200D ($91.41). The close below the 200-day is a major breakdown of the long-term trend. The SMA50D is still above the SMA200D, so there is no death cross yet, but the gap is narrowing quickly ($103.25 vs $91.41) and a cross is plausible within weeks if the decline continues. EMA21 crossed below EMA55 in mid-October.
- Lower highs and lower lows: Price peaked near $125 in September and has since made a sequence of lower highs and lower lows, with a roughly 38% decline. Rallies fail below EMA21.
- RSI: It has made lower highs since September and sits near 33, without a bullish divergence versus price. The RSI low of 27.8 on Nov 5 coincided with a close of $78.39, and today's close is nearly equal at $77.86 with RSI at 33, which is a very mild bullish divergence.
- CMF: It improved from -0.32 to about -0.04 while price fell further, a mild positive divergence that signals fading selling pressure.
- MACD: Both lines are flattening near -6.4 to -6.5, which points to slowing momentum, but there is no crossover. The histogram is barely negative.
- ADX/DI: ADX is rising through 25-30 with −DI dominant, which confirms trend strength.
CHART PATTERNS
- Primary pattern: A broad Bearish Rising Wedge / topping structure from the May-September advance has resolved into a breakdown, with the September high around $125 as the head of a larger distribution. The decline since looks like a sustained downtrend.
- Recent action: The last two weeks form a Bearish Flag/Pennant-like consolidation between about $78 and $88. Small candles and weak bounces have followed the sharp drop from $92 to $84, and the lower boundary near $77-78 is being retested.
- Bullish counterpoint: The nearly equal lows at about $78 on Nov 5 and Nov 13 could form a Bullish Double Bottom if price holds and breaks above the interim peak near $87.4 (the Nov 4 close). That is not confirmed. A double bottom would target the $87-88 neckline first, and the measured move is about $97.
- Bearish target: A break below $77-78 on a flag-style continuation projects roughly the prior leg down. A measured move of about $10-$12 points to $66-$68.
- Overall: The bearish continuation structure has the stronger evidence, since the trend, ADX, and DI all agree.
POTENTIAL SCENARIOS
- Scenario 1: Bearish Trend Continuation — Price breaks below the $77-78 double-bottom support, completing a bearish flag and extending the downtrend with ADX and −DI dominant. A death cross is approaching and the 200-day SMA has been lost. Trigger: daily close below $76.50 (just under the Nov 5/13 lows and the lower Bollinger Band at $74.41). Target: $68-$70 (measured move; roughly 1.5 ATR-based legs). Invalidation: daily close back above $84.60 (the Nov 11 high area) on rising volume. (50% probability)
- Scenario 2: Bullish Oversold Double-Bottom Bounce — RSI near oversold, CMF improving and flattening MACD lines support a relief rally from the $74-78 zone. Trigger: close above $84.60-$87.40 with a MACD bullish crossover. Target: $88-$90 (EMA21 and the Bollinger midline); a stronger move reaches the $91.4 SMA200D. Invalidation: close below $74.00. (30% probability)
- Scenario 3: Neutral Range Consolidation — Price chops between about $72 and $88 as selling exhausts but buyers do not commit. Trigger: failed breakdown and failed breakout. Target: $76-$82. Invalidation: a decisive close outside $72-$88. (20% probability)
PRICE TARGETS
- Target Price: $73.50 (34-day target)
- Expected Range: $62.50 to $84.50 (width $22.00 = about 28% of the current price; the 30-60 day guide is 12-18%, but this stock's high volatility (ATR $5.17, about 6.6% of price) and its 12% gap below EMA21 justify a somewhat wider band, covering roughly one standard deviation of 34-day movement)
- Key Levels: Support at $74.40 (lower Bollinger Band), then $70.00. Resistance at $84.60 (recent swing high), then $88.79 (EMA21).
OVERALL BIAS
OVERALL BIAS: BEARISH - Price is below every major moving average, including the 200-day SMA, with ADX near 30 and −DI at about double +DI. MACD remains negative, RSI has not shown a bullish reversal, and the bounces have come on light volume. The mild CMF improvement and oversold RSI raise the odds of a relief bounce but not a trend reversal. The target of $73.50 sits only modestly below the current price because of that bounce risk.
This is educational analysis and not financial advice.