HOOD 83-day bearish forecast — Nov 15, 2026
- Bias: Bearish
- Timeframe: 83 days (made Nov 15, 2026, target date Feb 5, 2027)
- Price at analysis: $77.86
- Price target: $72.00
- Expected range: $60.00 – $84.00
- Result: Pending — graded after the close on Feb 5, 2027
Get a free AI analysis of HOOD today
Analysis
TECHNICAL INDICATORS
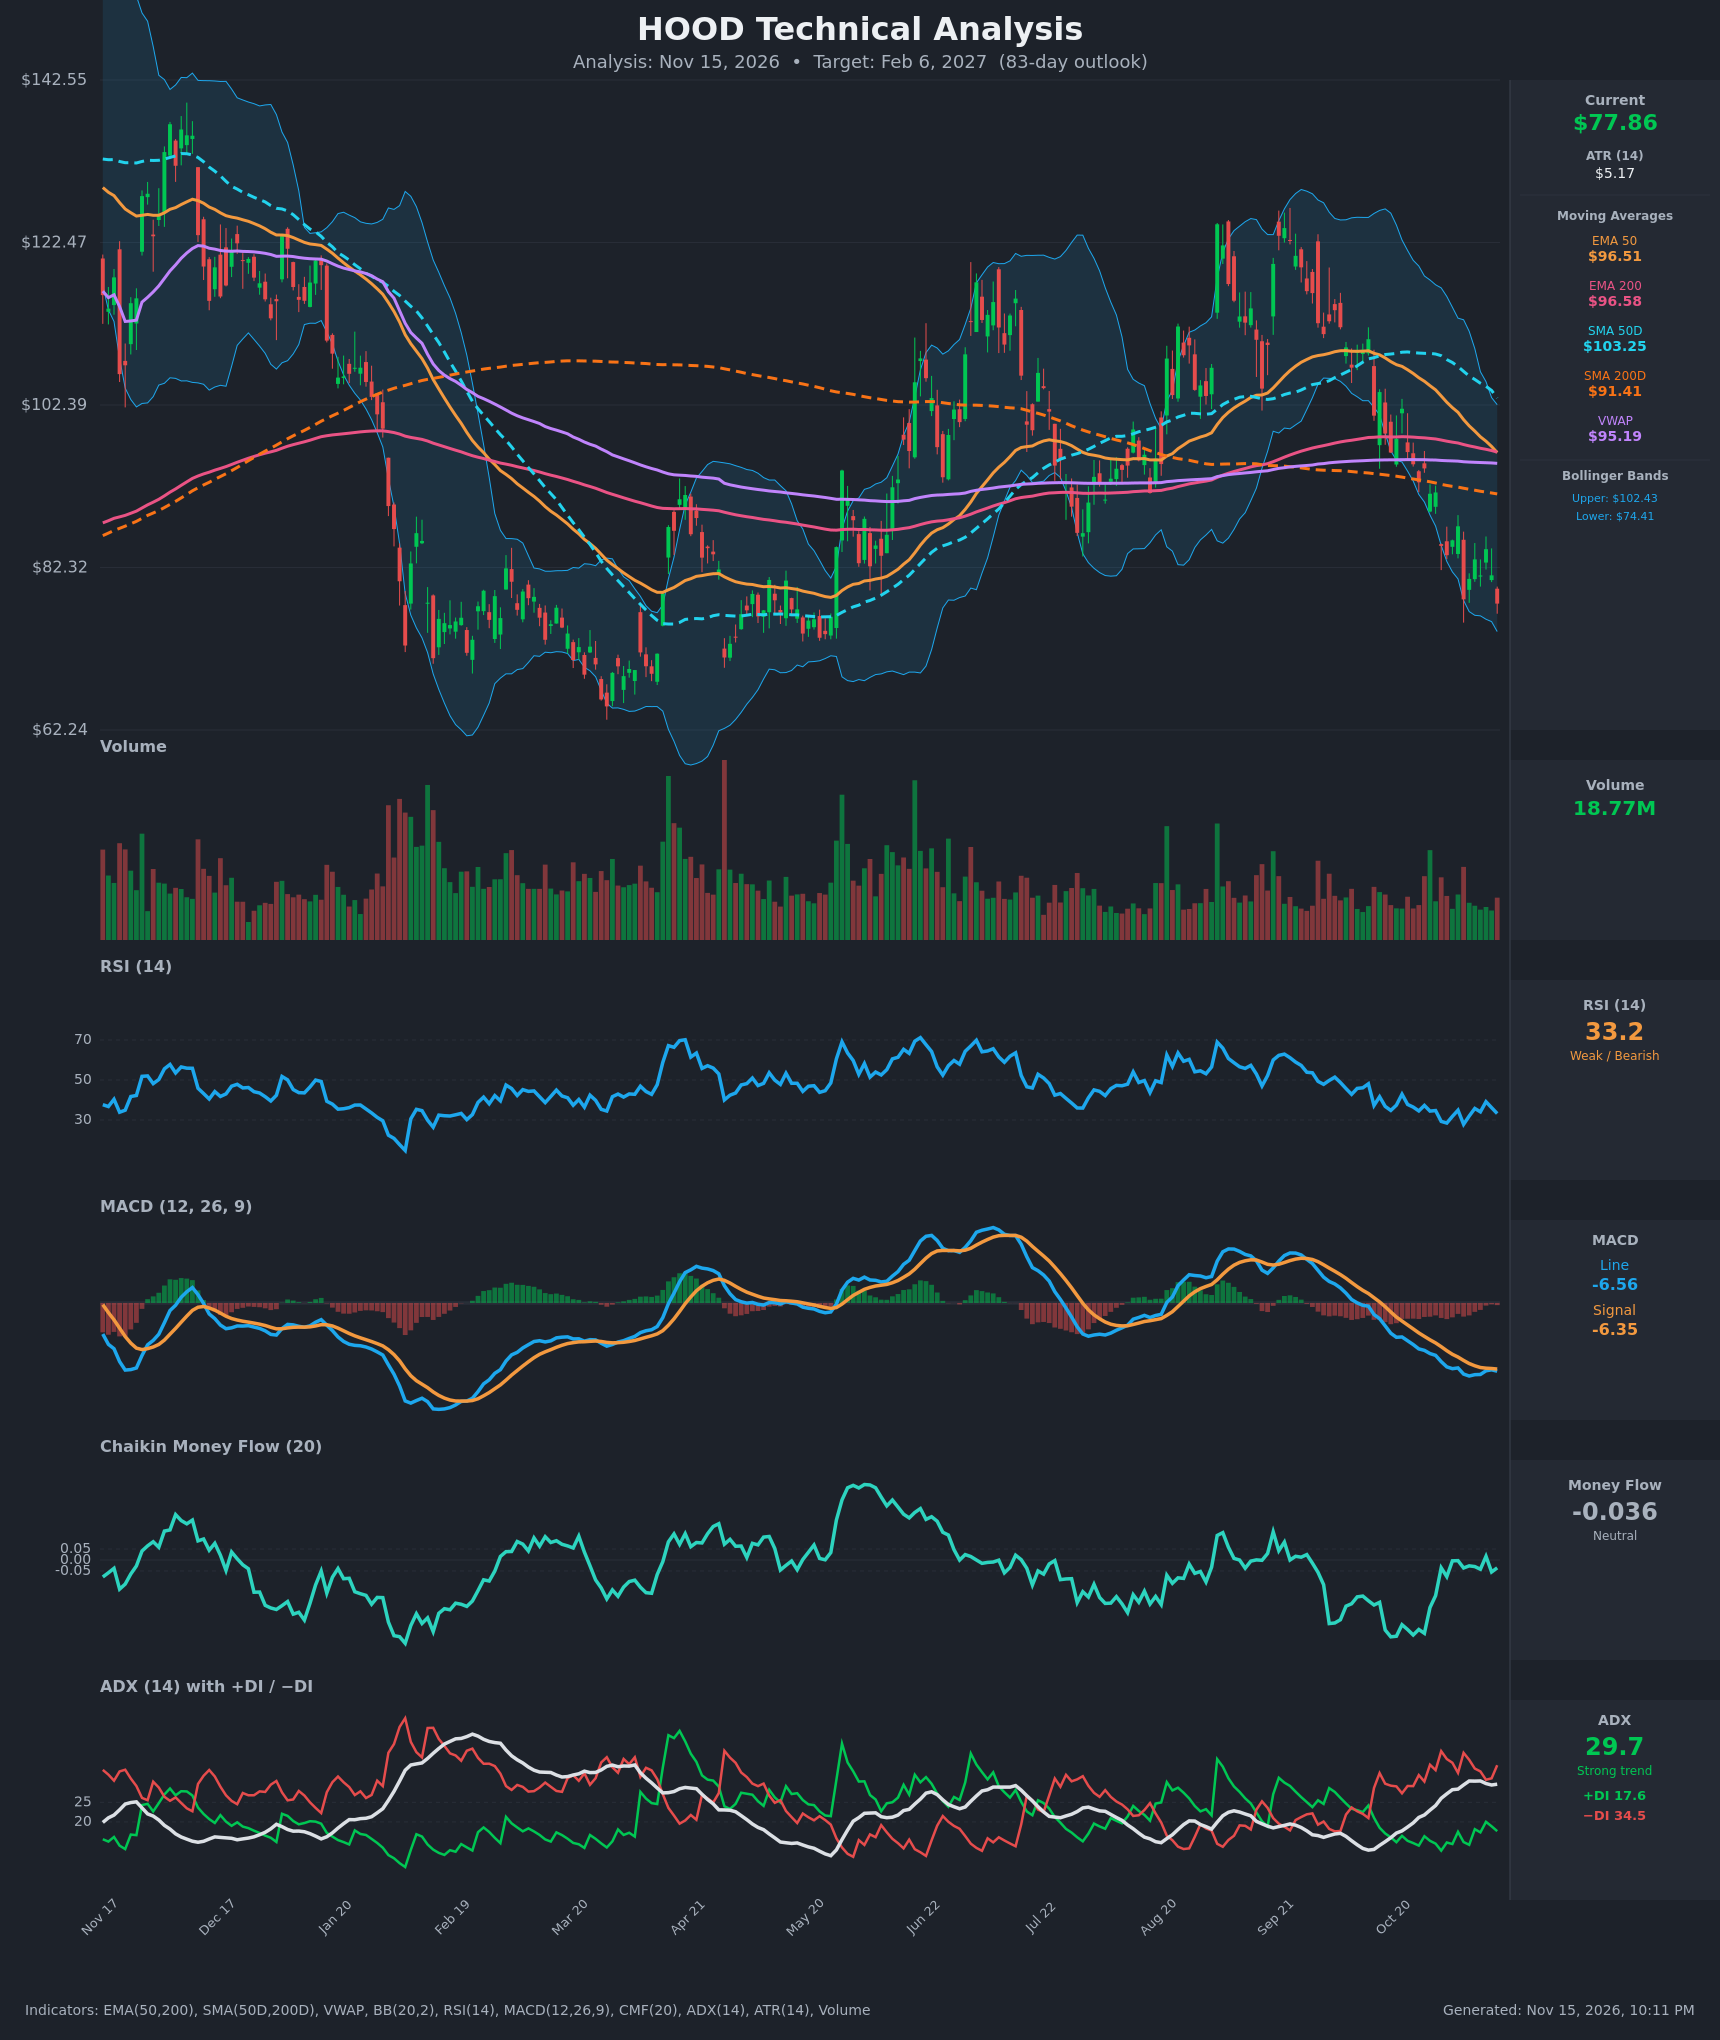
- RSI (14): 33.23, just above oversold (30). It has been in a 28–39 band for about 10 sessions and keeps making lower highs (39.1 on Nov 11 against 35.8 and 34.9 earlier). It has not yet shown a bullish reversal. [Bearish]
- 20 EMA: No 20 EMA value was supplied. The 50 EMA ($96.51) and 200 EMA ($96.58) are both about 24% above price. The EMA50 has just crossed below the EMA200, a bearish cross. Price is far below both, so they act as overhead resistance. [Bearish]
- MACD: Line -6.56 is below signal -6.35, and the histogram is slightly negative at about -0.21. The line is at its lows and has only just rolled back under the signal after a brief convergence. Momentum is bearish but stretched. [Bearish]
- Bollinger Bands (20): Upper $102.43, lower $74.41. Price at $77.86 sits in the lower quarter of the band, about $3.45 above the lower band. The bands are widening and sloping down, which points to a trending decline rather than a squeeze. A walk down the lower band is possible. [Bearish]
- CMF (20): -0.036, inside the neutral zone (±0.05). It has recovered from about -0.33 in late October but is flat to slightly negative, so selling pressure has eased without turning into accumulation. [Neutral]
- ADX (14): 29.7 and rising from 21 in late October, with −DI (34.5) well above +DI (17.6). This is a strong, bearish-controlled downtrend. [Strong Trend – Bearish]
- Volume: 18.77M, average to slightly below average, with no capitulation spike. The decline from about $125 has not seen the heavy-volume washout that marks a bottom. [Neutral / No capitulation]
Other moving averages:
- SMA50D at $103.25 is above SMA200D at $91.41, so there is no death cross yet. However, the SMA50D is rolling over and the gap is closing quickly.
- Price is below the SMA200D ($91.41) and below VWAP ($95.19).
DIVERGENCES & TRENDS
- There is no confirmed bullish RSI divergence. The RSI low (27.8 on Nov 5) came at a price of $78.39, and today's $77.86 is a marginally lower price with a higher RSI of 33.2. This is a very mild bullish divergence, but it is unconfirmed and weak.
- The MACD line is making new lows (-7.02 on Nov 6, -6.56 now). The signal line is still falling, so momentum has not turned.
- The ADX has risen from 21 to about 30 with −DI dominant, so the trend is strengthening, not exhausting.
- The EMA50 crossed below the EMA200 on Nov 13 ($96.51 vs $96.58), a short-term bearish cross. A SMA death cross is likely in the coming weeks if price does not recover, since the gap is $11.85 and narrowing by about $0.5–1 per day.
- Price has made a series of lower highs since the ~$125 September peak, and it now sits at the bottom of the Bollinger range.
- The chart shows a prior bounce zone at $65–$75 (March–April low near $65–68), which is the key long-term support.
CHART PATTERNS
- The decline from about $125 to $78 shows a Bearish Head and Shoulders / Double Top style reversal structure. The June–September highs near $125 are of similar height, and the neckline break around $90–$95 (the zone of the July–August base) has triggered. The measured move points toward roughly $60–$65.
- The sloped sequence of lower highs and lower lows since September also looks like a Bearish Flag/descending channel. Continuation lower is the default.
- The bullish counterpart would be a Double Bottom with the March–April lows near $65–$68, but that requires a reaction low and a reclaim of $90, so it is not in place.
POTENTIAL SCENARIOS
- Scenario 1: Bearish Trend Continuation — The −DI-led downtrend continues, with the broken neckline around $90–$95 acting as resistance and price retesting the March–April lows. Trigger: a close below $74.41 (lower Bollinger Band) and below the Nov 5 low of $78.39 on rising volume. Target: $66–$70, with the chart's prior low near $65. Invalidation: a daily close above $91.41 (SMA200D). (50% probability)
- Scenario 2: Neutral Base Building — Price oversold at RSI ~30 chops in a $70–$88 range as selling pressure fades (CMF near zero). Trigger: RSI holds above 30 and MACD histogram flattens. Target: $72–$85 range. Invalidation: a break below $70 or above $90. (25% probability)
- Scenario 3: Bullish Oversold Rebound — A mean-reversion bounce toward the declining EMA50/EMA200 cluster. Trigger: MACD bullish cross and RSI above 45 with a CMF move above +0.05. Target: $92–$97. Invalidation: a failure to hold $74 on the way up. (25% probability)
PRICE TARGETS
For the 83-day timeframe (Feb 6, 2027), the guidance is 18–30% range width. The ATR of $5.17 supports a wide range.
- Target Price: $72.00. This is a continuation lower, with a bounce probability that offsets part of the downside.
- Expected Range: $60.00 to $84.00. Width is $24 (about 30.8% of the current price, at the top of the guided band, justified by the high volatility of HOOD).
- Key Levels: Support at $74.41 (lower Bollinger Band), with a secondary level near $65 (prior low). Resistance at $84.58 (Nov 11 closing high), with a major level at $91.41 (SMA200D).
OVERALL BIAS
OVERALL BIAS: BEARISH - ADX near 30 with −DI far above +DI, price well below all moving averages, a fresh EMA50/200 bearish cross and MACD below its signal all favour further downside. The oversold RSI and neutral CMF argue for a possible bounce and keep conviction moderate.
This is educational analysis and not financial advice.