HOOD 20-day bearish forecast — Nov 15, 2026
- Bias: Bearish
- Timeframe: 20 days (made Nov 15, 2026, target date Dec 4, 2026)
- Price at analysis: $77.86
- Price target: $74.50
- Expected range: $69.50 – $78.50
- Result: Pending — graded after the close on Dec 4, 2026
Get a free AI analysis of HOOD today
Analysis
TECHNICAL INDICATORS
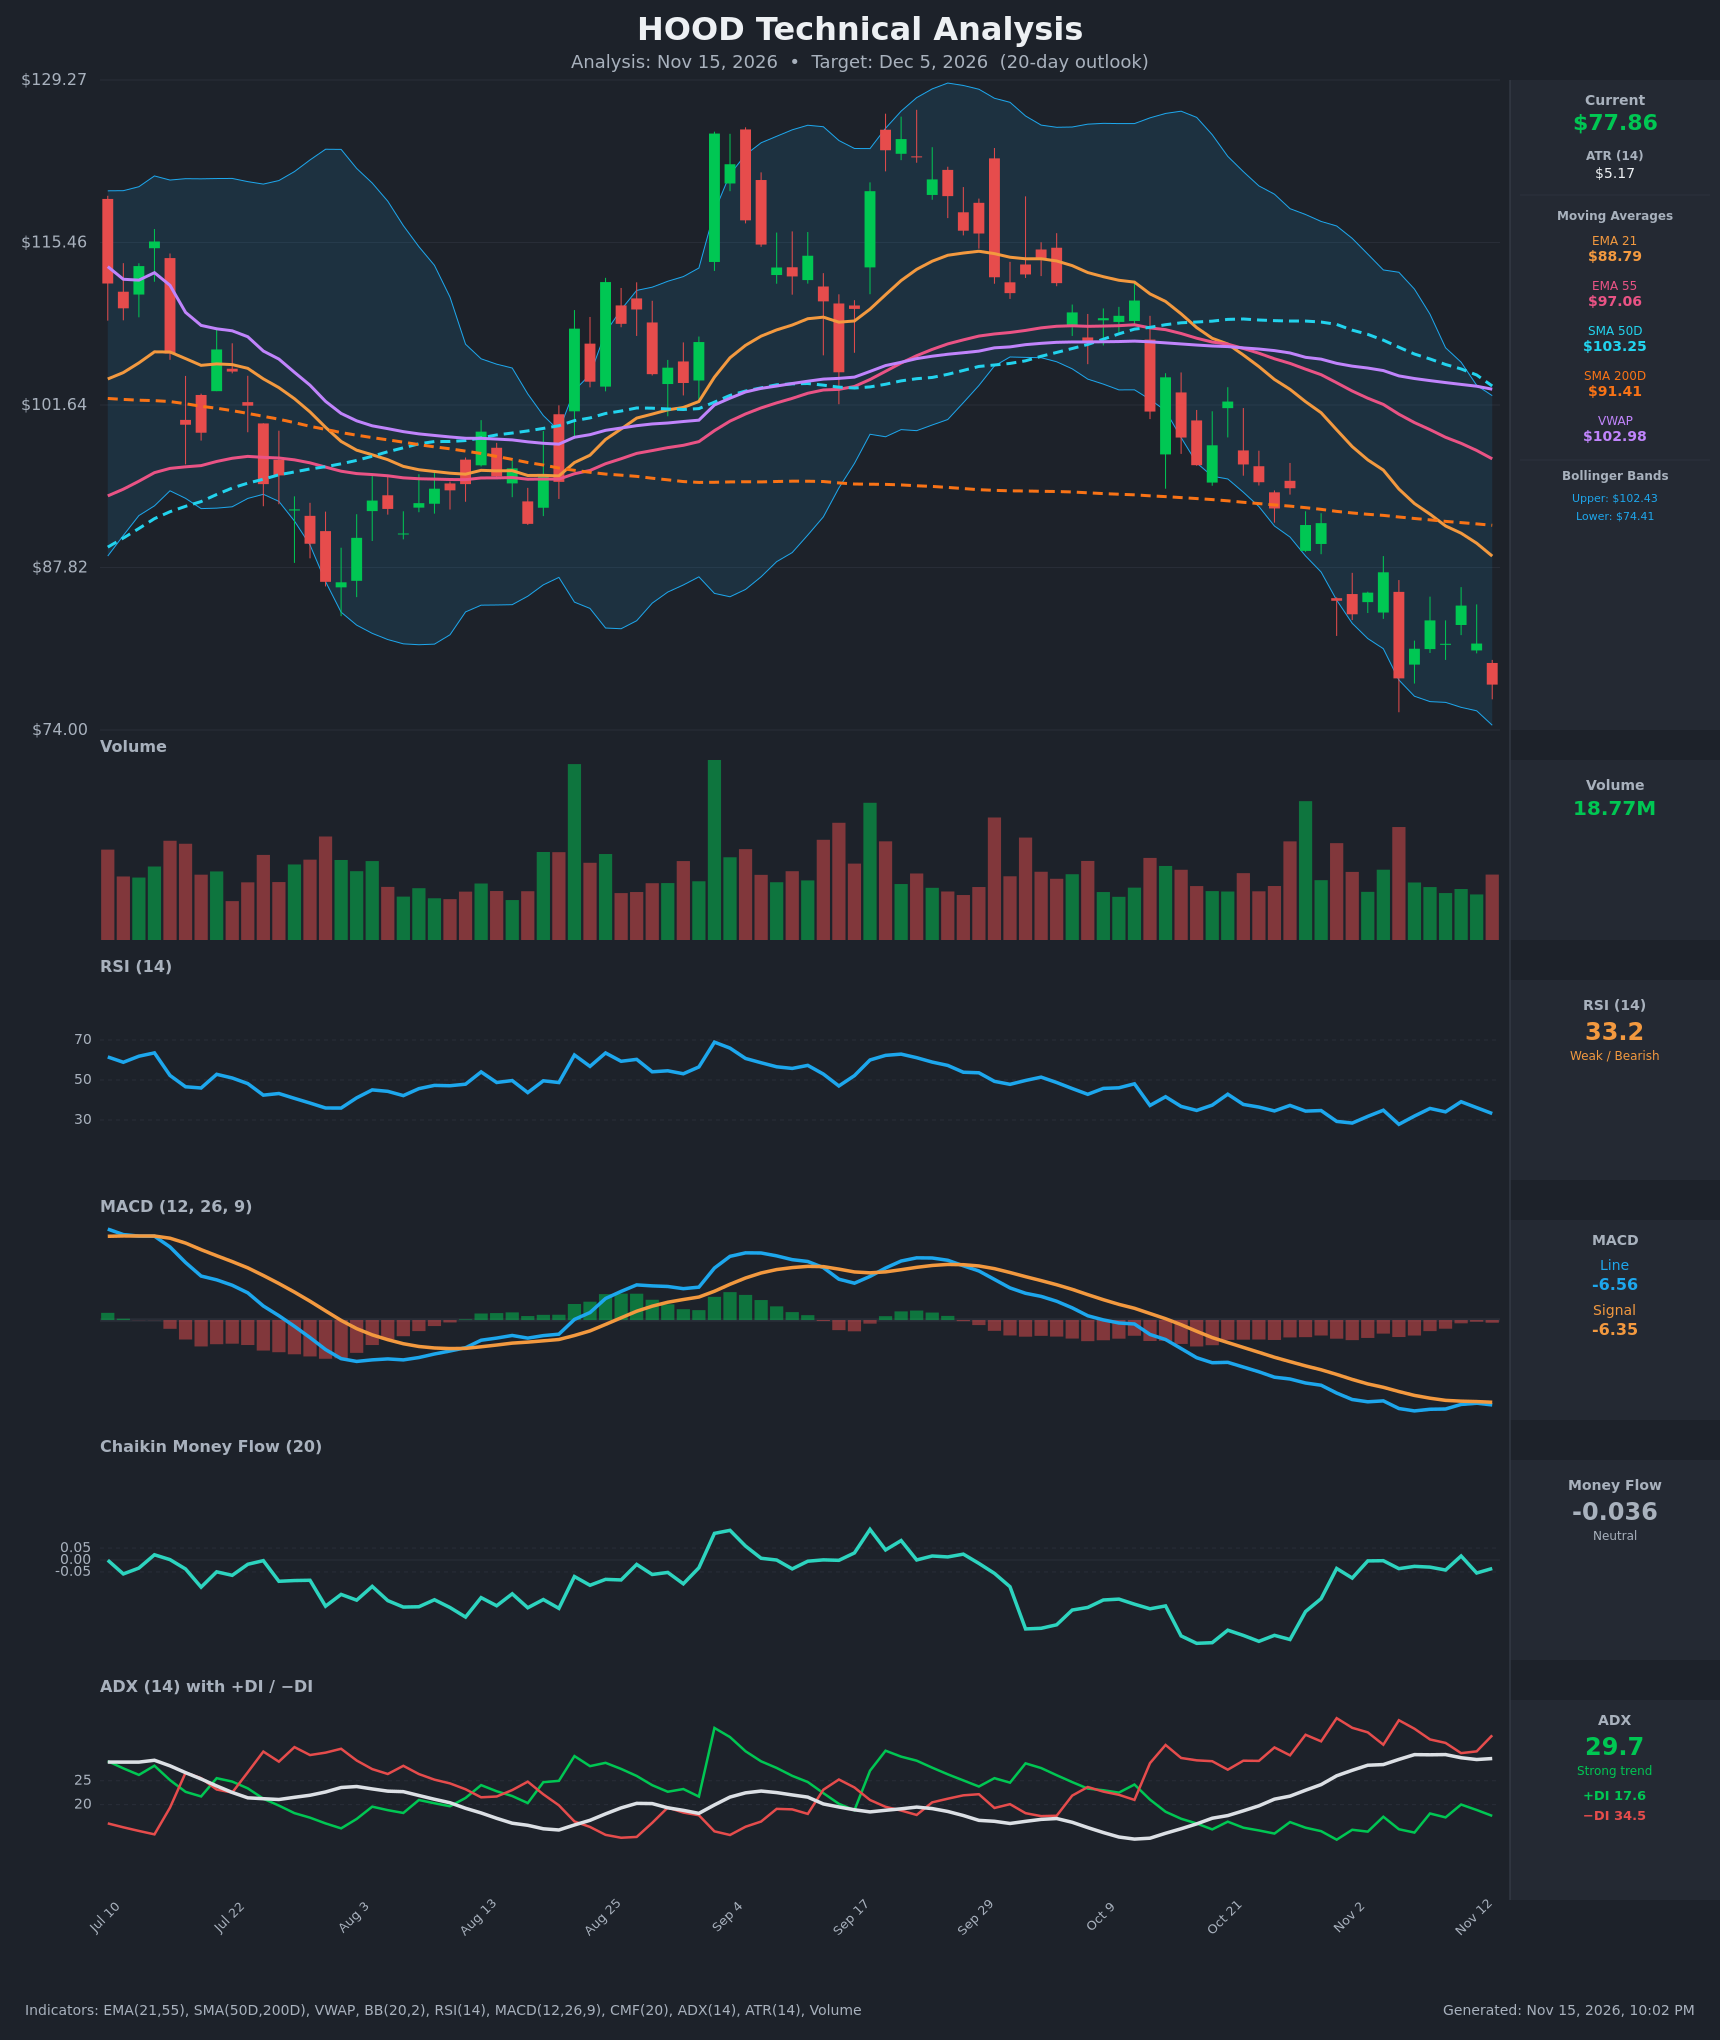
- RSI (14): 33.23, just above oversold and well below 50. It bottomed at 27.8 on Nov 5 and has since made a higher low even as price printed a lower closing low, so downside momentum is fading slightly. It is still in bearish territory. [Bearish]
- 20 EMA (EMA 21 = $88.79): Price at $77.86 is about 12% below the EMA 21, which is falling steeply. EMA 21 is also below EMA 55 ($97.06), a bearish cross already in place, so the EMAs act as overhead resistance. [Bearish]
- MACD: Line -6.56 is just below Signal -6.35, a histogram of about -0.21. The line crossed below the signal back in October and has stayed below it. The histogram has nearly flattened, and on Nov 11-12 the line briefly came close to crossing back up, so the downside impulse is decelerating. It remains negative and has not turned up. [Bearish]
- Bollinger Bands (20): Upper $102.43, lower $74.41. Price is in the bottom ~10% of the band, just $3.45 above the lower band, and the bands are wide, so volatility is elevated. It has been riding the lower half since late October. This is a trend-walk, though it also raises the odds of a snap-back toward the mid-band. [Bearish]
- CMF (20): -0.036, between ±0.05. It has recovered from about -0.33 in late October to roughly zero. Selling pressure has eased, but there is no accumulation yet. [Neutral]
- ADX (14): 29.7 and rising from about 21 in late October, with −DI (34.5) well above +DI (17.6). That is a strong, established downtrend with bears firmly in control. [Strong Trend – Bearish]
- Volume: 18.77M, roughly average with no capitulation spike. Red bars have been heavier on the breakdown legs (Oct 30, Nov 5), while the bounce days were lighter. The selloff has not shown exhaustion volume. [Neutral-to-Bearish]
DIVERGENCES & TRENDS
- Mild bullish RSI divergence: Price made a lower low (close $77.86 vs $78.39 on Nov 5), but RSI is at 33.2 vs 27.8. The MACD histogram is also shrinking. Together these hint at fading selling momentum, but without a confirming reversal they only suggest a relief bounce.
- Trend alignment is bearish:
- Price is below EMA 21, EMA 55, SMA 50D ($103.25), SMA 200D ($91.41) and VWAP ($102.98).
- EMA 21 is below EMA 55, a bearish cross already in place.
- SMA 50D is rolling over and still above SMA 200D, so the gap is narrowing. A death cross is possible in coming weeks if weakness persists.
- ADX rising with −DI dominant confirms the trend is strengthening, not exhausting.
- CMF improving from deep negative to neutral while price makes new lows is a modest positive divergence in money flow.
- Lower highs and lower lows since the early-October peak (~$115 down to $77.86), with every rally failing at the declining EMA 21.
CHART PATTERNS
- Primary: Bearish Flag / Bearish Pennant (continuation). After the sharp leg down from ~$100 to ~$84, price formed a small consolidation (lower highs at $87.41 and $84.58, with support around $78-$81) and is now breaking down again. A flag-pole measured move would point to the low $70s.
- Alternate: Bullish Falling Wedge. The sequence of lower highs and lower lows inside converging lines, with RSI divergence, could resolve into a reversal. This needs a break above ~$84-$85 to confirm and is not triggered yet.
- Descending channel behavior: Price is walking along the lower Bollinger Band, which supports continuation until the structure breaks.
POTENTIAL SCENARIOS
- Scenario 1: Bearish Trend Continuation — The strong downtrend (ADX near 30, −DI dominant) persists, with price breaking below the recent lows and the lower Bollinger Band. Trigger: daily close below $77 and then $74.41 (lower BB). Target: $72-$74 with an extension to ~$69.50. Invalidation: daily close above $84.60. (50% probability)
- Scenario 2: Bullish Oversold Relief Bounce — RSI divergence and improving CMF fuel a mean-reversion bounce toward the declining EMA 21, which would likely cap it. Trigger: close above $81.50 followed by a push through $84.60. Target: $86-$89 (EMA 21 at $88.79). Invalidation: close below $74.40. (33% probability)
- Scenario 3: Neutral Basing Range — Price chops between support near $74-$75 and resistance near $84 as selling momentum fades. Trigger: failure to break either side with fading ADX. Target: $77-$82. Invalidation: a decisive close outside the $74-$85 range. (17% probability)
PRICE TARGETS
- Target Price: $74.50 (20-day horizon, Dec 5, 2026)
- Expected Range: $69.50 to $78.50 (width $9.00 ≈ 11.6% of current price, consistent with the 14-21 day guidance)
- Key Levels: Support at $74.41 (lower Bollinger Band), Resistance at $84.60 (recent swing high, ahead of EMA 21 at $88.79)
OVERALL BIAS
OVERALL BIAS: BEARISH - Price sits below every major moving average with ADX near 30 and −DI far above +DI, MACD remains negative, and the pattern reads as a bearish continuation. The mild RSI divergence and neutral CMF argue for a possible relief bounce, but they do not yet show a trend change.
This is educational analysis and not financial advice.