HOOD 62-day bearish forecast — Nov 15, 2026
- Bias: Bearish
- Timeframe: 62 days (made Nov 15, 2026, target date Jan 15, 2027)
- Price at analysis: $77.86
- Price target: $71.50
- Expected range: $62.50 – $84.00
- Result: Pending — graded after the close on Jan 15, 2027
Get a free AI analysis of HOOD today
Analysis
TECHNICAL INDICATORS
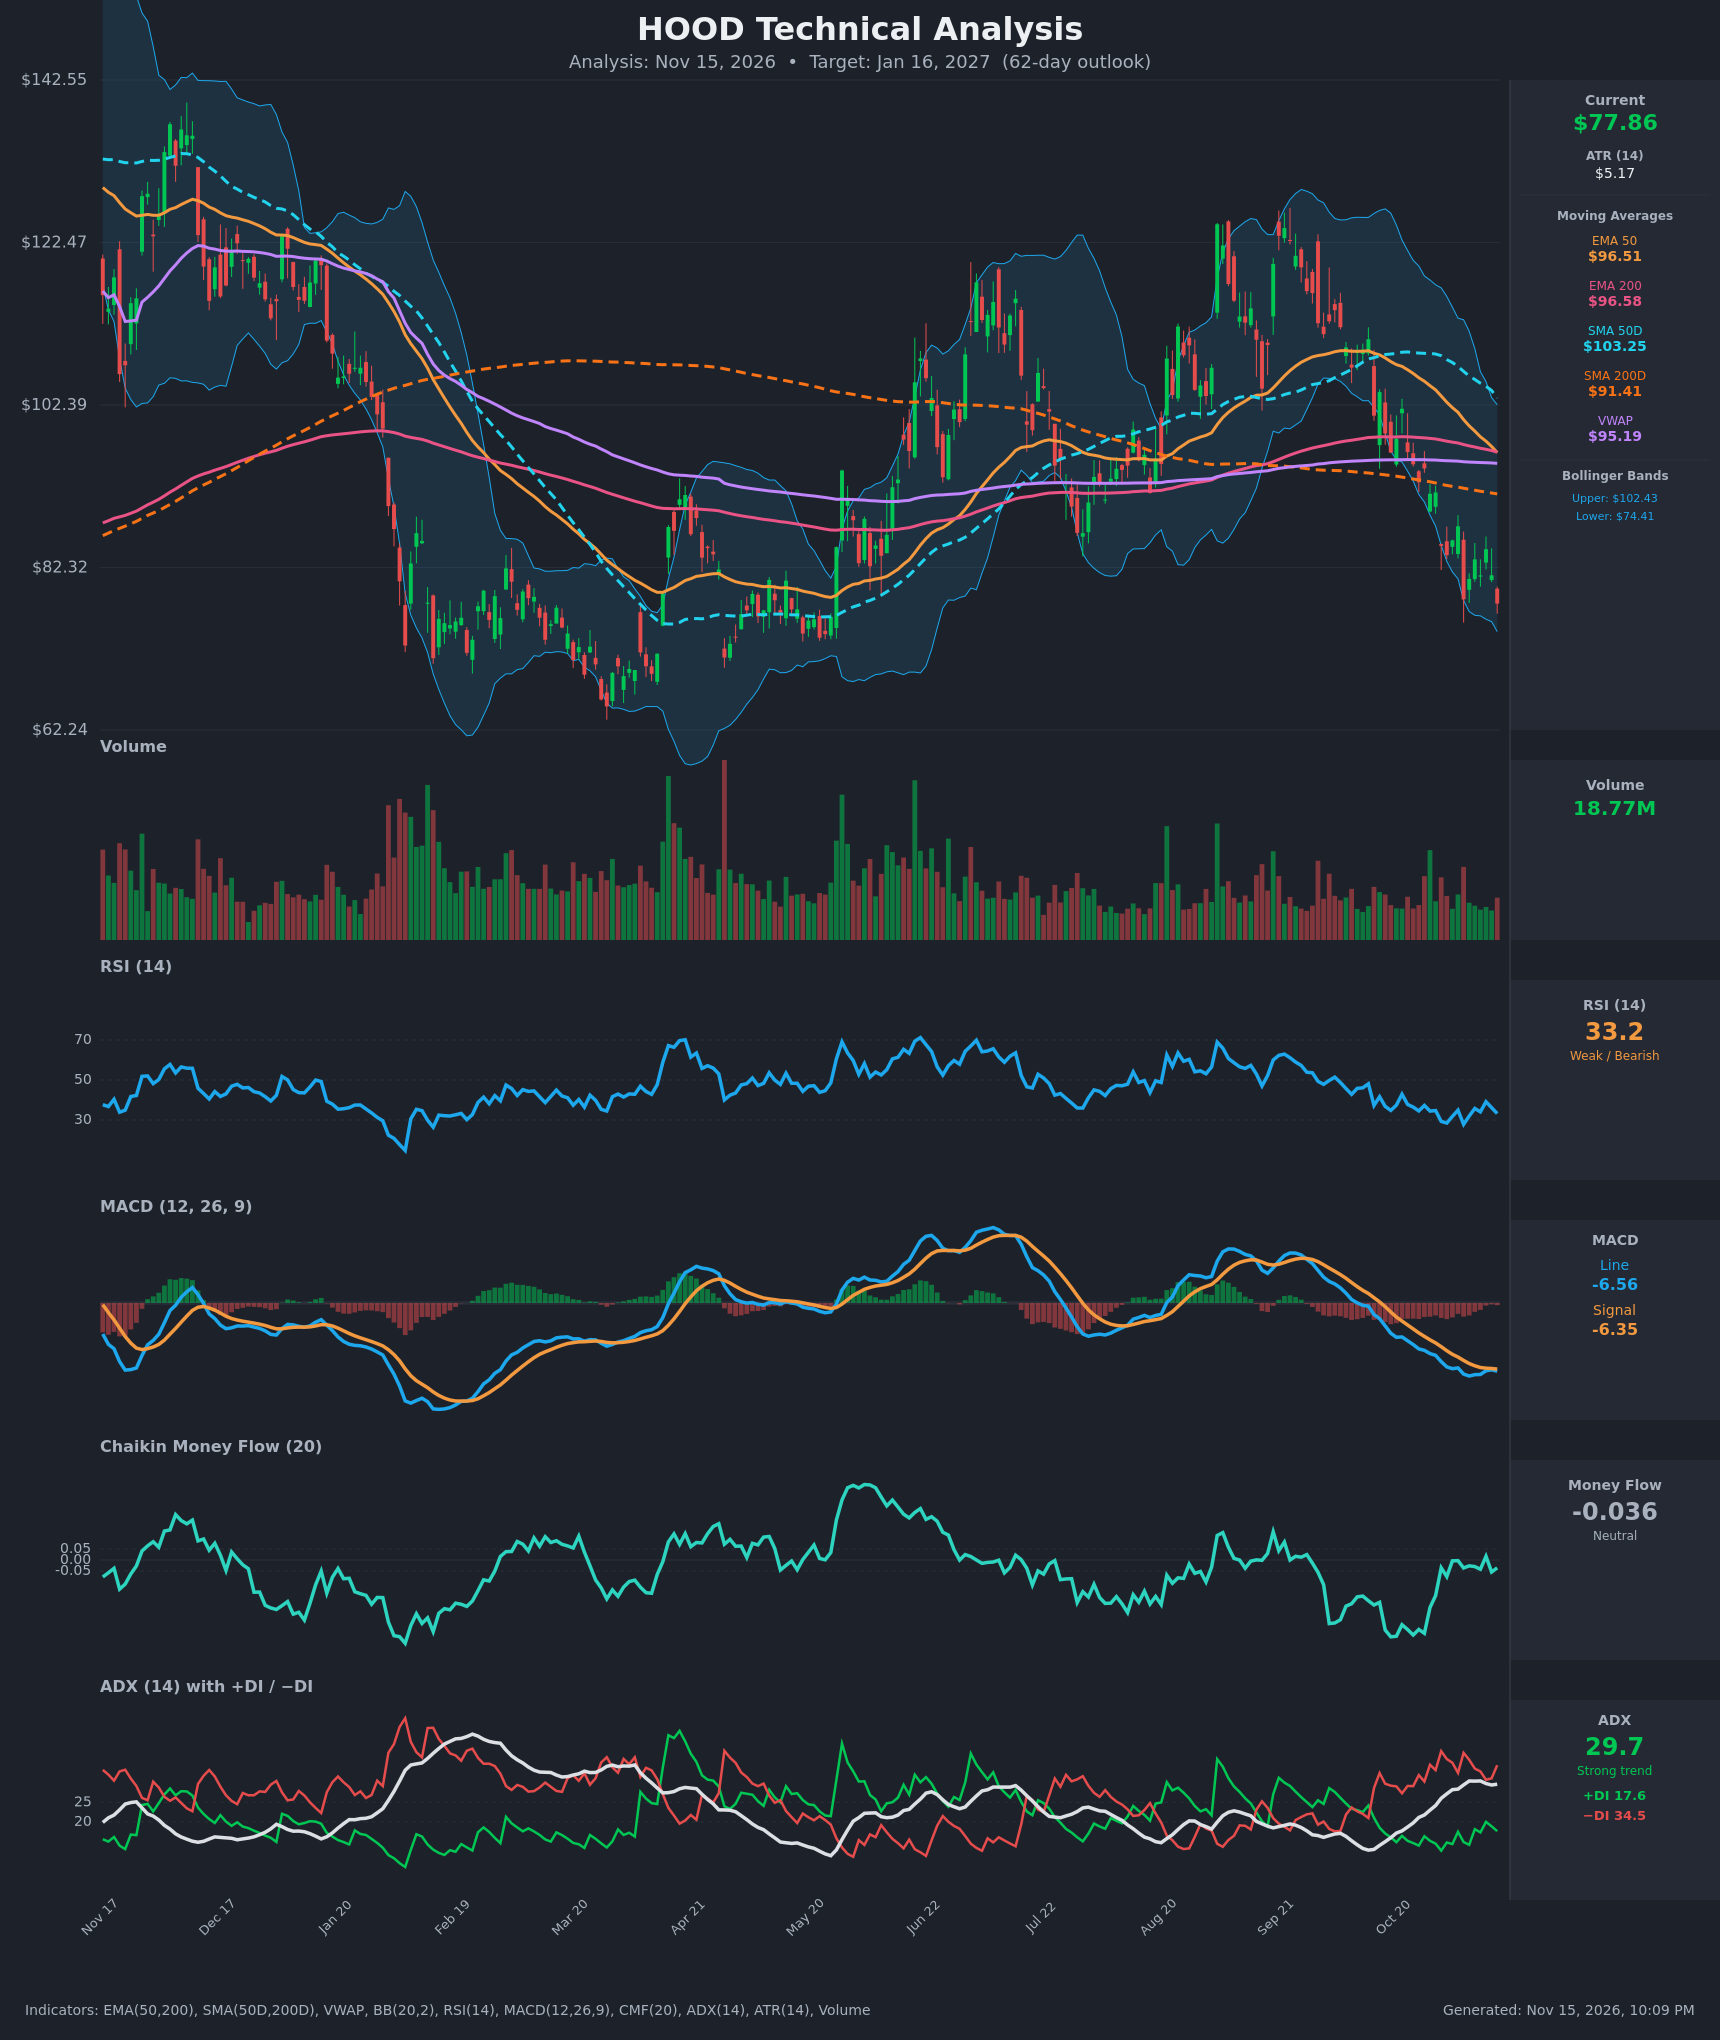
- RSI (14): 33.23, near the oversold line but still below 40. It has been in a 28-39 range for three weeks, with each bounce failing below 40 (Nov 11 peak at 39.1). Momentum is weak but not yet washed out. [Bearish]
- 20 EMA: Not supplied. The EMA 50 at $96.51 is about 24% above price and falling steeply, from $105.77 on Oct 26. Price has been below it throughout the decline, so it acts as heavy overhead resistance. [Bearish]
- MACD: Line -6.56 is below Signal -6.35, with a histogram of about -0.21. The two lines nearly converged on Nov 11-12 (-6.52 vs -6.27) and have now separated again. Both are deeply negative and near their lows, with no bullish crossover. [Bearish]
- Bollinger Bands (20): Upper $102.43, lower $74.41, so the bands are wide after the selloff. Price at $77.86 sits in the lower 12% of the band, about $3.45 above the lower band. It is not an outright break below the band, so the downside trend still has room but a bounce is plausible. [Bearish]
- CMF (20): -0.036, inside the neutral band (±0.05). It has recovered from -0.33 on Oct 27 and has hovered near zero for two weeks. Heavy distribution has stopped, but there is no accumulation either. [Neutral]
- ADX (14): 29.7, a strong trend and rising from 21 on Oct 26. −DI at 34.5 is well above +DI at 17.6, a roughly 2:1 spread. The −DI has been on top the whole period. [Strong Trend – Bearish]
- Volume: 18.77M, average to below average. There is no capitulation spike like the big volume bars in March-April, which marked prior lows. The decline has been orderly rather than panicked, so a final washout may still be ahead. [Neutral to mildly Bearish]
DIVERGENCES & TRENDS
- Mild bullish RSI divergence: On Nov 5 price closed at $78.39 with RSI 27.8. Today price is slightly lower at $77.86 with RSI 33.2. Selling momentum is fading, but the signal is small and unconfirmed.
- EMA cross: EMA50 ($96.51) has just slipped below EMA200 ($96.58), a fresh bearish cross.
- SMA cross: SMA50D ($103.25) is still above SMA200D ($91.41), but the gap is closing quickly. SMA50D is falling about $0.5-1 per day, so a death cross is plausible within the 62-day window.
- Price vs. long-term averages: Price is below every moving average and VWAP ($95.19), and also below SMA200D ($91.41), which signals a long-term downtrend.
- MACD: Both lines are in a persistent slide, with no bullish crossover since late September.
- DI: −DI has dominated since the late-September peak. ADX is rising with −DI on top, which confirms the trend.
- Chart structure: The decline from about $125 (Sep) to $78 is a sequence of lower highs and lower lows. The $65-$80 zone (March-May) is the prior base and the major support area.
CHART PATTERNS
- Bearish continuation in a downtrend: The sequence of lower highs and lower lows resembles the Bearish Flag/Pennant continuation family, though not a textbook match. The Nov 4 to Nov 13 bounces ($87.41 → $78.39 → $83-84 → $77.86) are lower highs, each failing at a lower level.
- Possible Bullish Falling Wedge: A wedge could be forming if lower highs converge with a slowly descending low zone near $78. It would need a break above about $85 to confirm.
- Prior range: March-May trading at roughly $65-$85 forms a base. A measured move back toward the $65-$72 zone is the bearish target. The upside objective if the wedge resolves bullishly is $88-$95, near the gap down from the EMAs.
- Bottom line: No confirmed reversal pattern. The trend is down.
POTENTIAL SCENARIOS
- Scenario 1: Bearish Trend Continuation — Price stays below the falling EMAs, −DI remains dominant with ADX above 25, and a death cross forms on the daily SMAs. Sellers push through the lower Bollinger Band toward the March-May base. Trigger: daily close below $74.40 (lower BB). Target: $70-$72 first, then $65-$67 on a washout. Invalidation: daily close above $85-$87 (the Nov 4 high area and the failed bounce zone). (50% probability)
- Scenario 2: Bullish Oversold Relief Rally — RSI divergence and proximity to the lower band trigger a bounce, with price filling back toward the EMAs and VWAP. Trigger: close above $84.60 with MACD histogram turning positive. Target: $88-$92, with a stretch to the SMA200D at $91.40. Invalidation: close back below $74.40. (30% probability)
- Scenario 3: Neutral Basing Range — Price chops between $72 and $85 as selling exhausts and CMF stays near zero, with ADX fading. Trigger: ADX rolls below 25 with RSI stuck at 35-45. Target: $76-$80. Invalidation: close outside $70-$86. (20% probability)
PRICE TARGETS
Current price is $77.86. Over 62 days, with ATR of $5.17 and a strong downtrend, I expect a drift lower toward the prior base with a wide range.
- Target Price: $71.50 (62-day, about -8.2%)
- Expected Range: $62.50 to $84.00 (width $21.50, about 27.6% of current price, consistent with the 18-30% guideline for 61-180 days)
- Key Levels: Support at $74.40 (lower Bollinger Band; below that $70 and the $65 March-April base), Resistance at $84.60 (Nov 11 close; above that $87.40, then the $96.5 EMAs)
OVERALL BIAS
OVERALL BIAS: BEARISH - Price is below every moving average and SMA200D. ADX of 29.7 is rising with −DI (34.5) well above +DI (17.6), and MACD remains below its signal with a fresh EMA50/EMA200 bearish cross. A mild RSI divergence and proximity to the lower band raise the odds of a relief bounce, but the weight of evidence favors a drift toward the $65-$72 base.
This is educational analysis and not financial advice.