HOOD 27-day bearish forecast — Nov 15, 2026
- Bias: Bearish
- Timeframe: 27 days (made Nov 15, 2026, target date Dec 11, 2026)
- Price at analysis: $77.86
- Price target: $73.50
- Expected range: $68.00 – $80.00
- Result: Pending — graded after the close on Dec 11, 2026
Get a free AI analysis of HOOD today
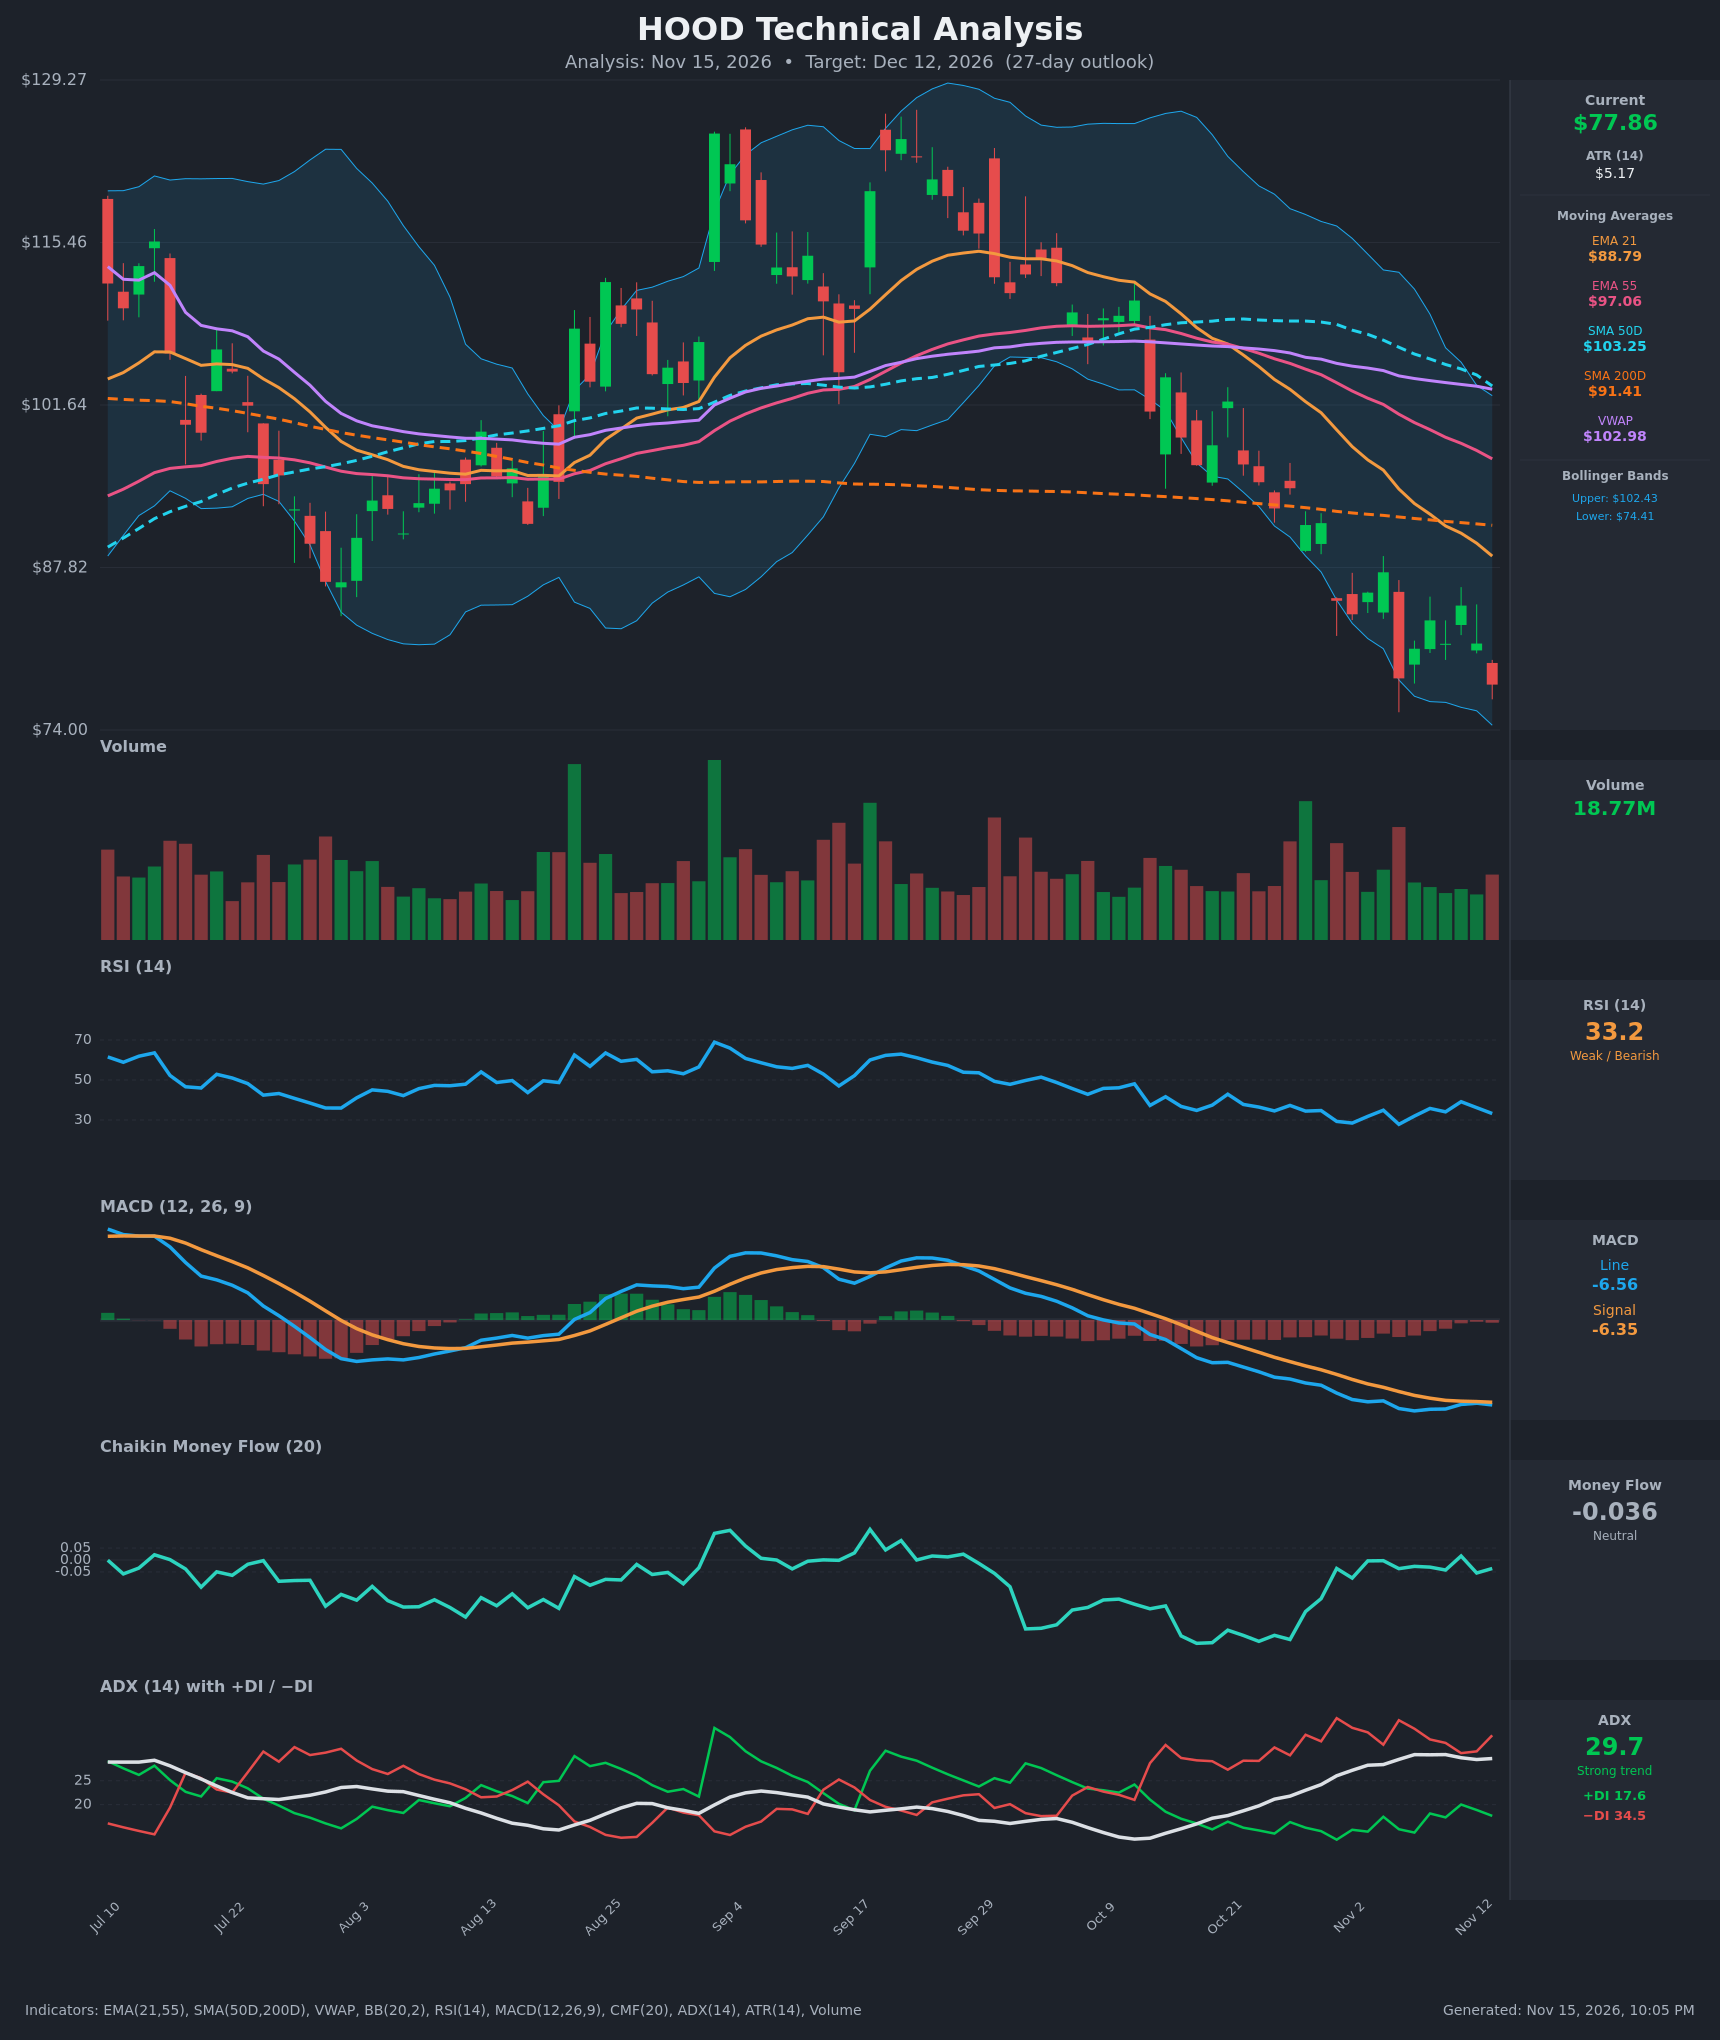
Analysis
TECHNICAL INDICATORS
- RSI (14): 33.23, just above oversold (30). It has bounced between about 28 and 39 since late October without a bullish reversal. Readings of 27.8 (Nov 5) and 28.5 (Nov 2) were the lows, and each rally has failed below 40, which is typical of a bear-market RSI range. [Bearish]
- 20 EMA: The supplied value is the EMA 21 at $88.79. Price ($77.86) is about 12% below it and the EMA is still falling steeply. EMA21 is also below EMA55 ($97.06), so the bearish crossover is long established. The EMA21 is acting as overhead resistance. [Bearish]
- MACD: Line -6.56 vs signal -6.35, so the line is slightly below the signal with a small negative histogram of about -0.21. Both lines are at their lowest levels of the visible period. Momentum is no longer accelerating downward, as the histogram has flattened, but there is no bullish cross yet. [Bearish]
- Bollinger Bands (20): Upper $102.43, lower $74.41, with the midline near $88.4. Price sits in the bottom 10% of the band, only about 4.6% above the lower band, after a sustained walk along it. The bands are wide, which signals high volatility. A walk down the lower band in a strong trend is bearish, though a snap-back toward the midline is possible. [Bearish]
- CMF (20): -0.036, which sits in the neutral zone (±0.05). It has recovered from about -0.33 in late October. Selling pressure has eased, but there is no real accumulation. [Neutral]
- ADX (14): 29.7 and rising, with −DI (34.5) far above +DI (17.6). That is a strong established downtrend with bears firmly in control. +DI has failed to cross above −DI on every bounce. [Strong Trend – Bearish]
- Volume: 18.77M. Heavier volume has come on the red sell-off days (Oct 30, Nov 5), while the green bounce days have printed lighter volume. This is not capitulation volume. [Mildly Bearish]
DIVERGENCES & TRENDS
- Moving-average structure: Price ($77.86) is below the VWAP ($102.98), SMA50D ($103.25), EMA55 ($97.06), SMA200D ($91.41) and EMA21 ($88.79). That is a fully bearish stack, and price has been below the SMA200D since late October.
- Death cross watch: The SMA50D ($103.25) is still above the SMA200D ($91.41), but the gap has narrowed from about $15.7 to $11.8 in 15 bars. At this pace a death cross could occur around the end of the 27-day window.
- Divergence: There is no clean bullish divergence. Price made lower lows ($83.84, then $78.39, then $77.86) while RSI lows stayed in the 28–33 zone. That is mild stabilization, not a confirmed divergence.
- Momentum: MACD histogram compression and the CMF recovery suggest selling is slowing. ADX is still rising with −DI dominant, so the trend remains intact.
- Lower highs: Rallies keep failing at lower levels ($94.56, then $87.41, then $84.58). The latest closes ($81.35, $77.86) are rolling over again after the Nov 11 bounce.
CHART PATTERNS
- Primary read: Bearish continuation. The sequence of lower highs and lower lows resembles a descending channel or bearish flag/pennant within a strong downtrend (see Bearish Flag/Pennant in the reference). A sustained break below $74.41 would extend the leg down by roughly the measured move of the recent flush, toward $68–$70.
- Alternative read: Bullish falling wedge. The recent compression in the lows could be a Bullish Falling Wedge, but this is not confirmed. It requires a break above about $84–$85, where the EMA21 will be declining toward the mid-$80s.
- Targets: Downside is $70 on a breakdown below $74. Upside on a failed breakdown is a bounce to $84–$88 (EMA21 and the Nov rally highs).
POTENTIAL SCENARIOS
- Scenario 1: Bearish Trend Continuation — The strong ADX and −DI dominance, price below all key averages and failed bounces point to another leg lower. Trigger: Daily close below the lower Bollinger Band / $74.40 on rising volume. Target: $70.00–$73.50, with an extension toward $68. Invalidation: Daily close above $84.00 with MACD crossing above its signal. (50% probability)
- Scenario 2: Bullish Oversold Bounce / Mean Reversion — RSI near 30, price at the lower band and CMF recovering could set up a relief rally toward the falling EMA21. Trigger: Hold above $74 and reclaim $80–$81, with RSI above 40. Target: $84–$88.80 (EMA21). Invalidation: Close below $74.00. (33% probability)
- Scenario 3: Neutral Basing Range — Price chops between roughly $74 and $84 as selling exhausts but buyers lack conviction. Trigger: Several sessions of narrow range and fading ADX. Target: $76–$82. Invalidation: Close outside $73–$85. (17% probability)
PRICE TARGETS
27-day horizon (about 15% range width, consistent with the 12–18% guidance for 30–60 days, scaled slightly down):
- Target Price: $73.50 (a ~5.6% decline from $77.86)
- Expected Range: $68.00 to $80.00 (width $12.00 ≈ 15.4% of current price)
- Key Levels: Support at $74.40 (lower Bollinger Band), Resistance at $84.00 (recent bounce highs / EMA21 zone)
OVERALL BIAS
OVERALL BIAS: BEARISH - Price is below every major moving average with ADX near 30 and −DI far above +DI. MACD remains negative, and rallies keep failing at lower highs, so the path of least resistance is lower. The oversold RSI and lower-band proximity make a relief bounce a real risk, but not the base case.
This is educational analysis and not financial advice.