HOOD 4-day bearish forecast — Nov 1, 2026
- Bias: Bearish
- Timeframe: 4 days (made Nov 1, 2026, target date Nov 4, 2026)
- Price at analysis: $84.91
- Price target: $83.40
- Expected range: $81.20 – $86.40
- Result: Incorrect (+3.4%) — closed at $87.76 on Nov 4, 2026; quality score 10/100
Get a free AI analysis of HOOD today
Analysis
TECHNICAL INDICATORS
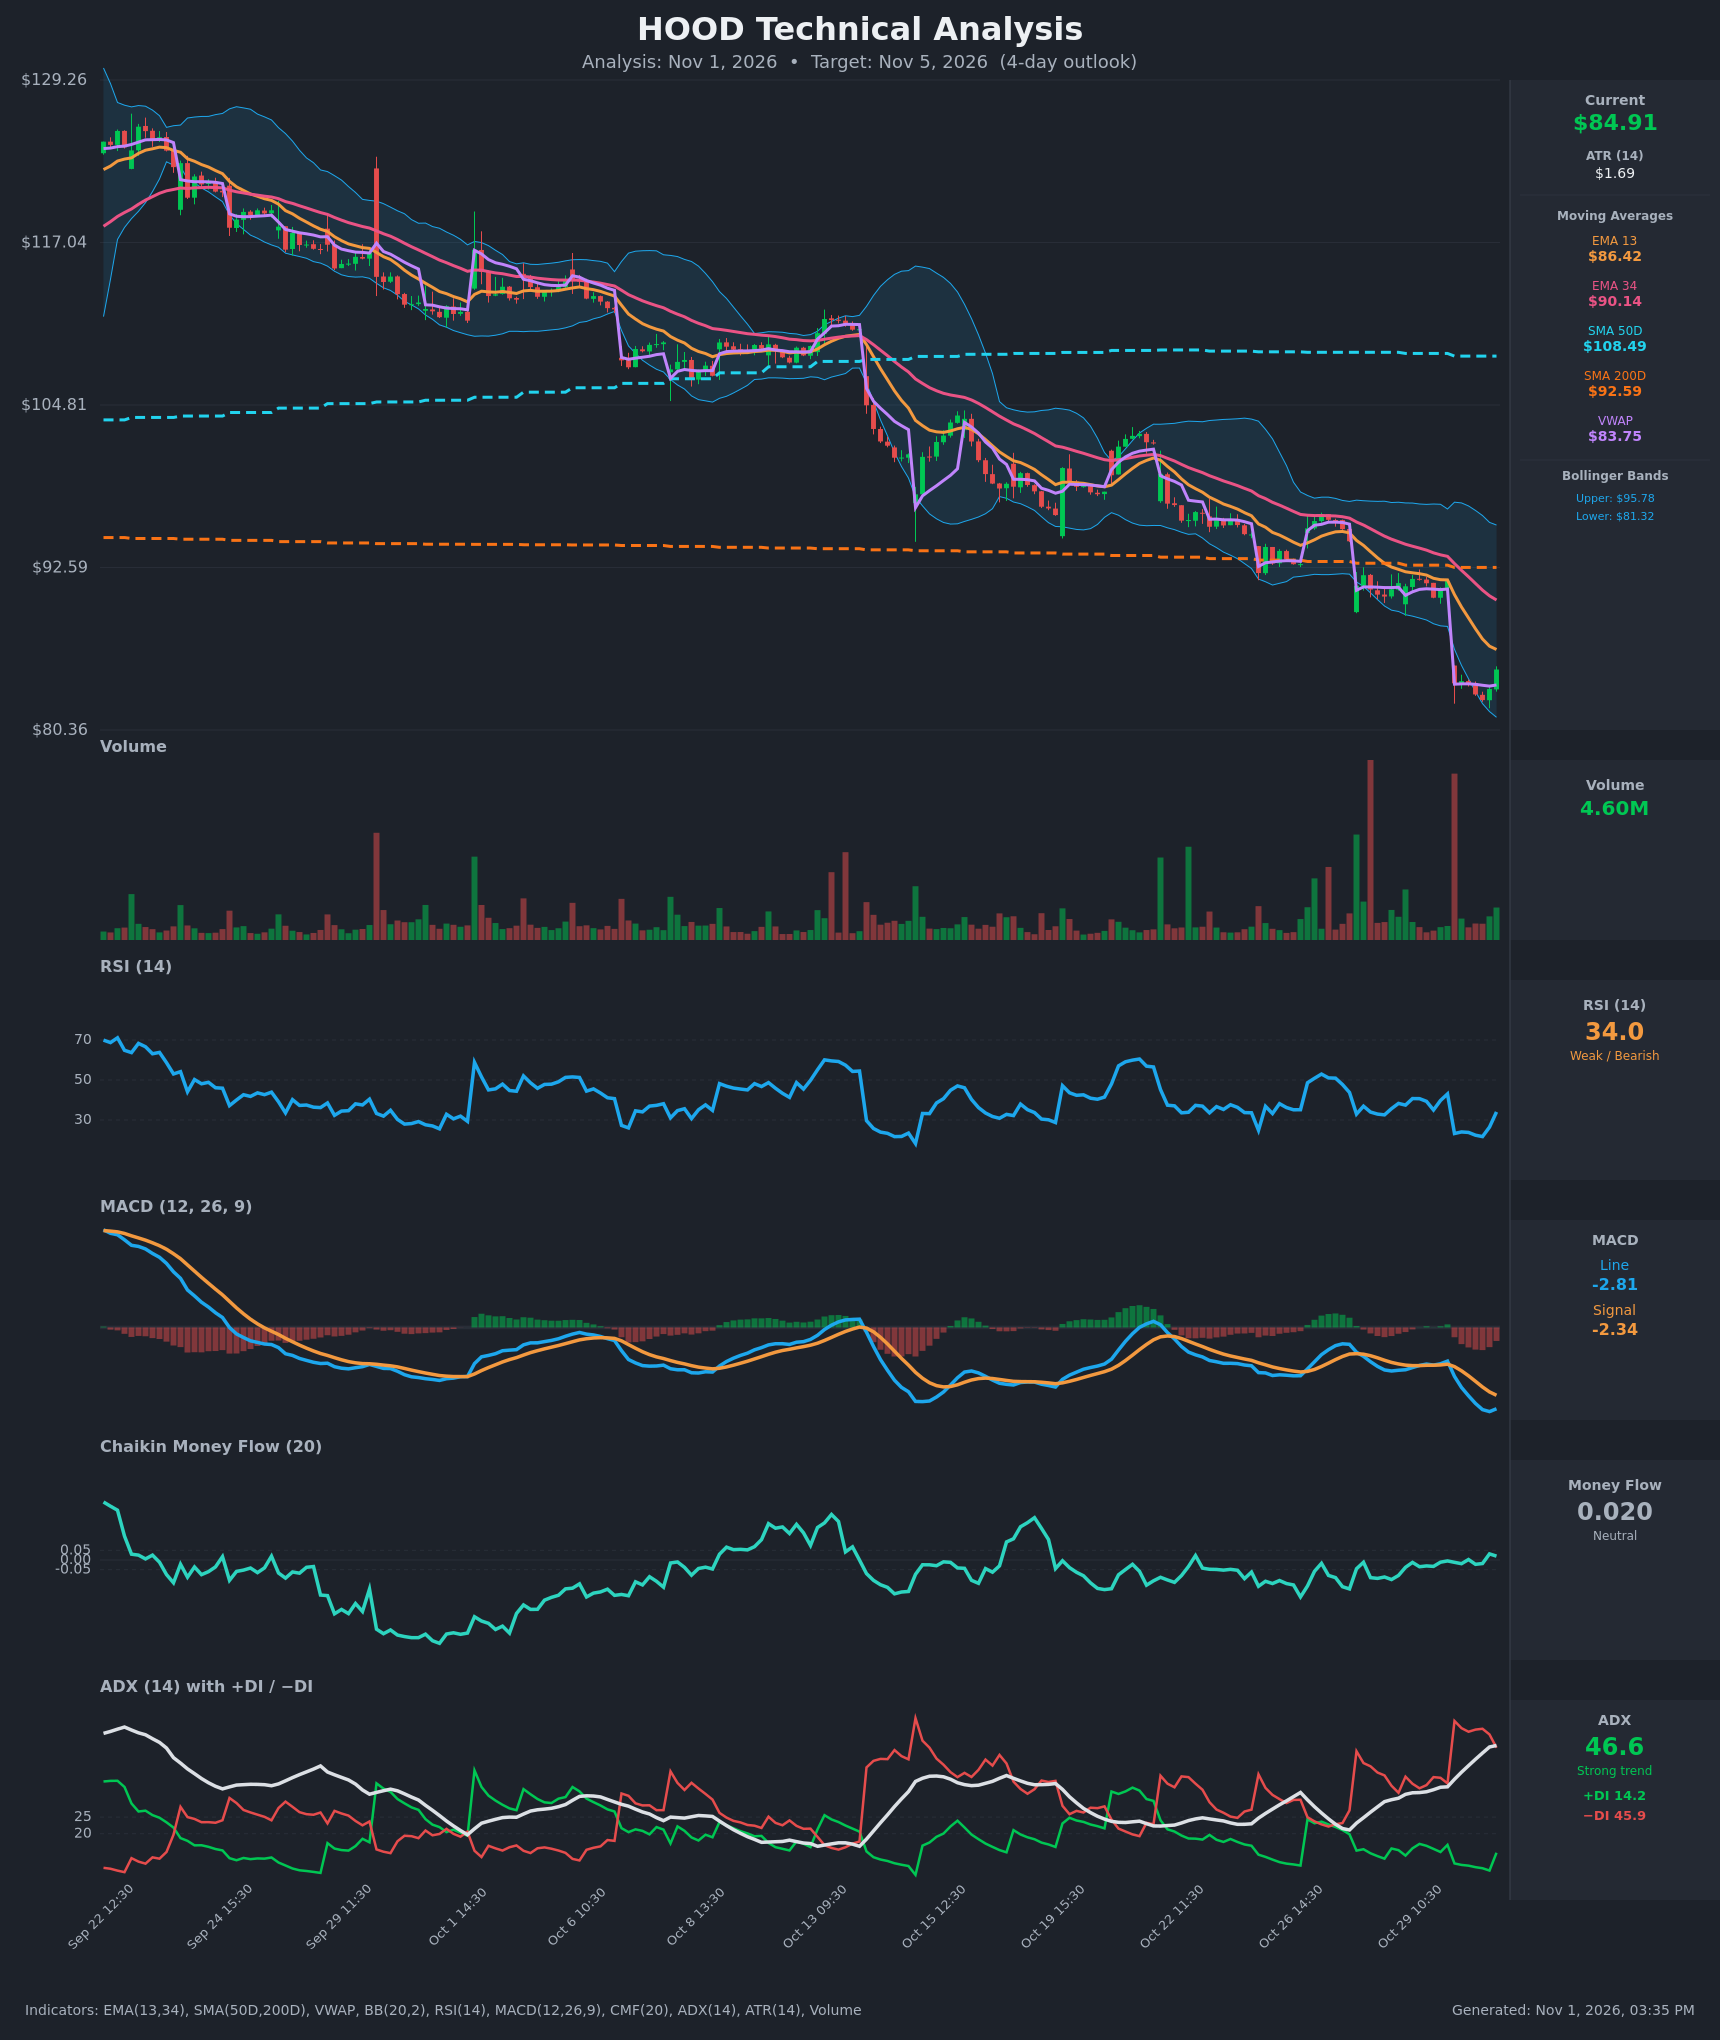
- RSI (14): 34.03. It bounced sharply from a deeply oversold 21.7 on Oct 30, but it is still below 40 and has not reclaimed 50. A bounce is under way inside a bearish momentum regime. [Bearish]
- 20 EMA: The supplied values are EMA 13 at $86.42 and EMA 34 at $90.14. Price ($84.91) is below both. EMA 13 sits just overhead as first resistance and is still falling. EMA 13 is below EMA 34, a bearish alignment. [Bearish]
- MACD: Line -2.81 vs signal -2.34, histogram about -0.47. The line has been below the signal since the Oct 30 gap. The histogram is narrowing from about -0.68 on the previous bar, so downside momentum is easing slightly, but there is no bullish crossover. [Bearish]
- Bollinger Bands (20): Upper $95.78, lower $81.32. Price is in the lower quarter of the bands, about $3.6 above the lower band. The bands are wide after the gap-down. Price tagged the lower band on Oct 30 and bounced, which favors a relief rally, but the trend is a "band walk" lower. [Neutral]
- CMF (20): 0.020. It is flat to slightly positive, between -0.05 and +0.05. That means no clear accumulation, only tentative buying on the bounce. [Neutral]
- ADX (14): 46.6 and rising, with +DI at 14.2 and −DI at 45.9. This is a very strong downtrend with sellers firmly in control. +DI ticked up from 8.9, but the gap is still huge. Readings this high can also signal trend exhaustion. [Strong Trend – Bearish]
- Volume: 4.60M on the latest bar, which was a green bounce candle. The earlier gap-down session carried a heavy red volume spike (capitulation-style). Volume on the bounce is moderate and not yet convincing. [Neutral / mild relief buying]
Moving-average context:
- Price is below SMA 200 ($92.59) and far below SMA 50 ($108.49). SMA 50 is already below SMA 200, so the death cross is long established.
- Price is above VWAP ($83.75) by only about $1.16. This is a minor positive, and VWAP is the nearest intraday support.
DIVERGENCES & TRENDS
- Divergences: There is no clean bullish divergence yet. RSI made a higher low on the bounce, but price only just made its low, so it is too early to call.
- Trend: The chart shows a persistent staircase of lower highs and lower lows from about $129 to about $82. The Oct 30 session gapped down about 8.4% ($91.56 to $83.87) and the move has stayed below the former range ever since.
- Crossovers and breaks:
- EMA 13 is below EMA 34.
- Price is below SMA 200.
- MACD is below its signal.
- −DI dominates +DI.
- Price is back above VWAP and has bounced off the lower Bollinger Band.
- Net read: The trend indicators are heavily bearish, and the oscillators are showing a modest oversold bounce. For a 4-day horizon, the bounce looks like a counter-trend rally into EMA 13 resistance.
CHART PATTERNS
- Broad descending channel: This is the dominant structure, a series of lower highs and lower lows. It is similar to a descending channel or flag continuation to the downside.
- Possible Bearish Pennant / Flag (low confidence): After the Oct 30 gap-down, price is stabilizing in a tight area ($82.6–$85). If the bounce stalls near the $86.4 EMA 13, this matches the Bearish Flag/Pennant continuation. The measured move would point toward the low $70s, but that is outside the 4-day window.
- Bullish counter-signal (not confirmed): Oversold RSI, a lower Bollinger Band tag and a gap area to fill ($91.56) could drive a relief rally. There is no reversal pattern such as a double bottom yet.
POTENTIAL SCENARIOS
- Scenario 1: Bearish Trend Continuation — The relief bounce fades at the EMA 13 / gap-fill resistance zone, and sellers (ADX 46.6, −DI 45.9) push price back to the lower Bollinger Band. Trigger: rejection at $86.4 or a break below VWAP ($83.75). Target: $81.30–$82.50. Invalidation: a daily/hourly close above $87.50. (50% probability)
- Scenario 2: Bullish Oversold Relief Rally — RSI recovers toward 45–50 and price squeezes through EMA 13 on short covering. Trigger: a close above $86.42 on rising volume. Target: $88.50–$90.00 (EMA 34 at about $90). Invalidation: a break below $83.00. (33% probability)
- Scenario 3: Neutral Consolidation — Price chops between VWAP/lower band and EMA 13 as momentum resets. Trigger: lack of follow-through either way. Target: $83.50–$86.00. Invalidation: a break outside $81.30–$87.50. (17% probability)
PRICE TARGETS
- Target Price: $83.40 (4-day horizon)
- Expected Range: $81.20 to $86.40 (width $5.20, about 6.1% of the current price, appropriate for a 4-day window)
- Key Levels: Support at $81.32 (lower Bollinger Band), Resistance at $86.42 (EMA 13)
OVERALL BIAS
OVERALL BIAS: BEARISH - A very strong downtrend (ADX 46.6, −DI 45.9 vs +DI 14.2), price below every key moving average, and a MACD still below its signal favor a fade of the oversold bounce at the $86.4 EMA 13 and a retest of the $81–$83 area. The main risk is a short-covering rally, since RSI is recovering and the lower Bollinger Band has been tagged.
This is educational analysis and not financial advice.