PLTR 4-day bearish forecast — Nov 1, 2026
- Bias: Bearish
- Timeframe: 4 days (made Nov 1, 2026, target date Nov 4, 2026)
- Price at analysis: $184.10
- Price target: $181.50
- Expected range: $175.50 – $189.50
- Result: Correct (-6.8%) — closed at $171.50 on Nov 4, 2026; quality score 54/100
Get a free AI analysis of PLTR today
Analysis
TECHNICAL INDICATORS
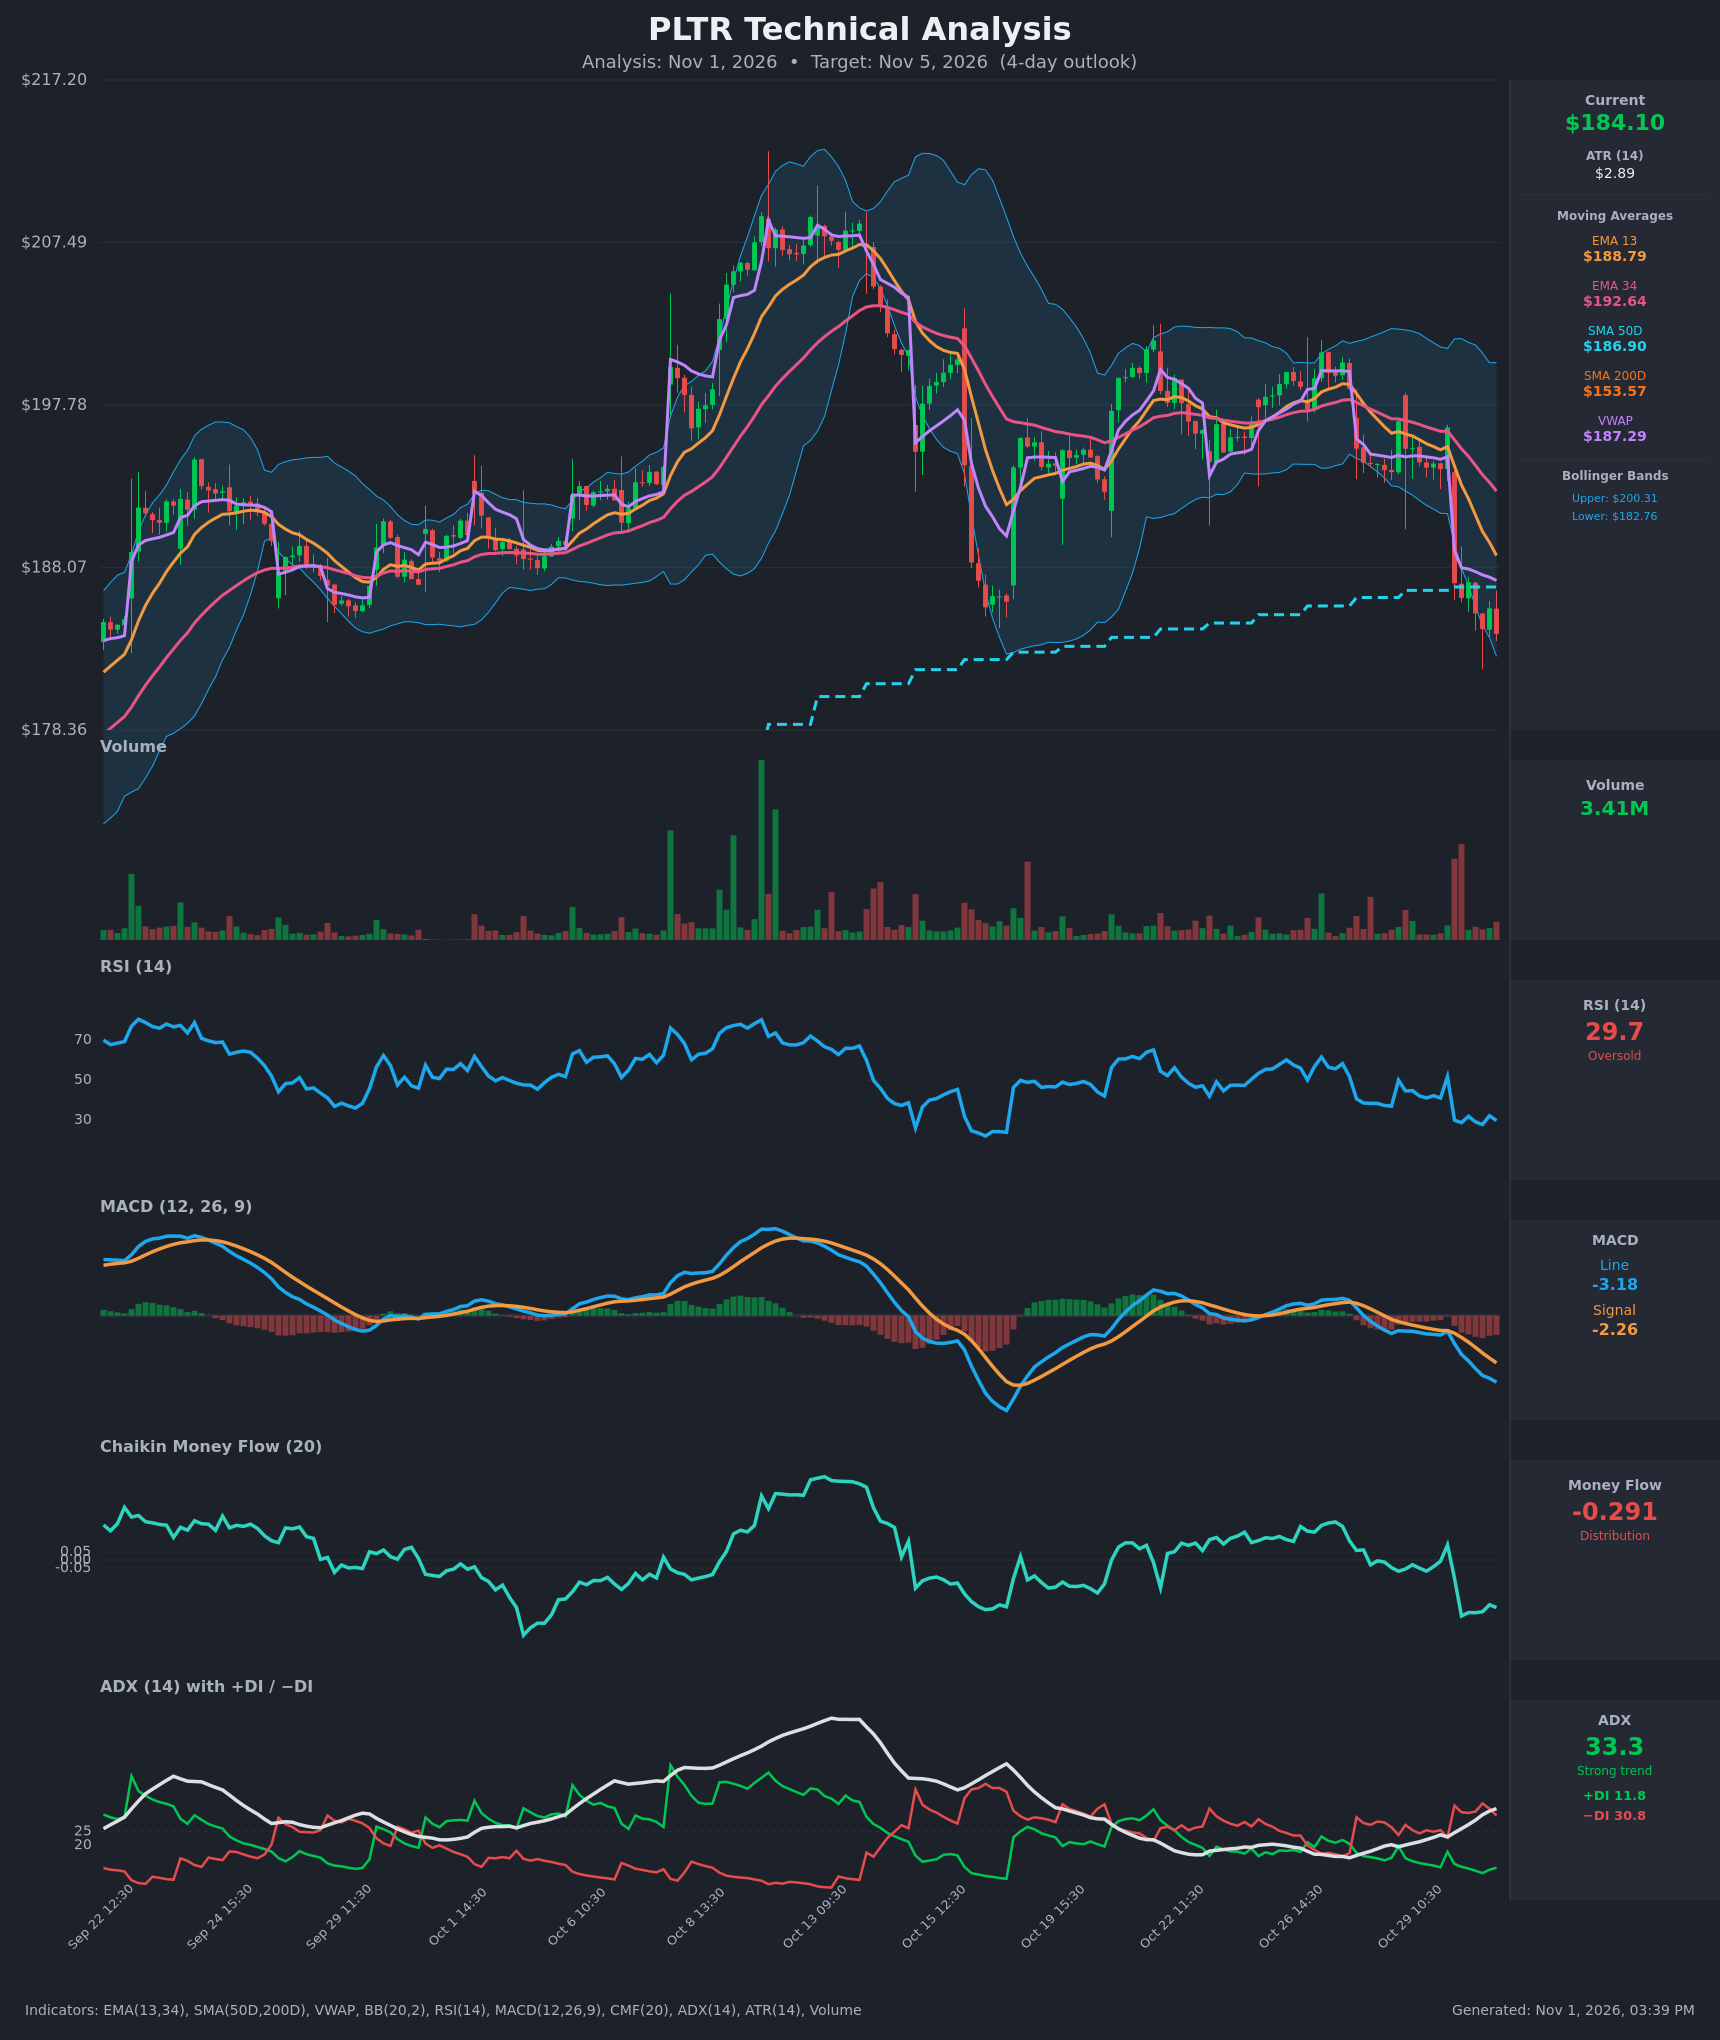
- RSI (14): 29.73, oversold, after a sharp drop from about 51.7 on Oct 29 to the high 20s and low 30s. It has made no meaningful bounce, and each rally attempt has failed near 32. Oversold can persist in a strong downtrend, so it is not a buy signal by itself. [Bearish]
- 20 EMA: The data supplies the EMA 13 at $188.79 and the EMA 34 at $192.64. Price at $184.10 is below both, and the EMA 13 is below the EMA 34 and falling steeply. Both averages act as overhead resistance. [Bearish]
- MACD: The line is -3.18 against a signal of -2.26, so it is below the signal and the gap is widening. The histogram is negative and expanding, and the line is making new lows. [Bearish]
- Bollinger Bands (20): Upper $200.31, lower $182.76. Price is hugging the lower band, only $1.34 above it. The bands are wide, which reflects the recent volatility. Band-walking in a downtrend is bearish, though a snap-back toward the midline (about $191.5) is possible. [Bearish]
- CMF (20): -0.291, well below -0.05, which is strong distribution. It fell from about 0 to -0.34 during the Oct 30 selloff and has not recovered. [Distribution]
- ADX (14): 33.3 and rising from about 19, with −DI at 30.8 well above +DI at 11.8. This is a strong, established downtrend with bears in control. [Strong Trend – Bearish]
- Volume: 3.41M on the latest bar. There was a clear volume spike on the Oct 30 gap-down (the large red bars on the chart), which confirms the selling as institutional distribution. Volume has moderated since but the selling bias remains. [Bearish – distribution]
DIVERGENCES & TRENDS
- There is no bullish RSI divergence yet. RSI is making lows in line with price, and the 29.7 reading matches the price low.
- MACD, ADX and CMF all confirm the downtrend, so there is no bearish divergence to flag either.
- Price gapped from $196.44 to $187.14 at the Oct 30 open and kept sliding. The EMA 13 is rolling over toward the SMA 50D ($186.90), and price has now broken below the SMA 50D and VWAP ($187.29).
- The EMA 13/34 bearish crossover already occurred and the gap is widening.
- The SMA 200D ($153.57) is far below, so the long-term trend is still up. The SMA 50D is well above the SMA 200D, so there is no death cross.
- The −DI/+DI spread is wide and ADX is rising, which points to trend acceleration rather than exhaustion.
CHART PATTERNS
- The closest match to the diagram is a Bearish Pennant / Flag continuation (sideways consolidation in the $193–$198 range from Oct 22 to 29), which broke down with the gap on Oct 30. The measured move of the flagpole implies a further drop of roughly $8–$12 from the breakdown area, pointing toward about $178–$182.
- The consolidation was also loosely a Bearish Rectangle / Double Top around $207–$210 (the October peak) followed by a lower high near $198, which is a lower-high structure.
- Near-term support is the lower Bollinger Band at $182.76. Beneath it, the chart's lower axis shows $178.36, which is the next obvious zone.
- Oversold conditions raise the risk of a reflex bounce toward the $187–$189 cluster (SMA 50D, VWAP, EMA 13), which would likely be a sell-the-rally area.
POTENTIAL SCENARIOS
- Scenario 1: Bearish Trend Continuation — The −DI dominance, expanding MACD and heavy distribution drive price below the lower Bollinger Band toward the $178 area. Trigger: a close below $182.76. Target: $179–$180. Invalidation: a close back above $188.8 (EMA 13 / VWAP). (50% probability)
- Scenario 2: Bearish Dead-Cat Bounce Then Rollover — Oversold RSI produces a relief rally into the $187–$189 resistance cluster, which fails and price ends the period modestly lower. Trigger: a bounce off $182–$183 with RSI above 35. Target: $182–$184 at day 4, after a spike to $188. Invalidation: a daily close above $189.5. (30% probability)
- Scenario 3: Bullish Oversold Reversal — Heavy oversold conditions and a lower-band touch trigger a sustained snap-back toward the middle band. Trigger: a reclaim of $188.8 on rising volume and a CMF turn upward. Target: $191–$192. Invalidation: a failure below $184. (20% probability)
PRICE TARGETS
- Target Price: $181.50 (4-day horizon; about 1.4% below current, reflecting continuation with some oversold-bounce friction)
- Expected Range: $175.50 to $189.50 (width $14.00, about 7.6% of the current price, in line with the guidance for a short horizon of this length; ATR $2.89 over 4 days supports roughly ±$6–7)
- Key Levels: Support at $182.76 (lower Bollinger Band), with $178.36 below it. Resistance at $186.90 (SMA 50D), then $188.79 (EMA 13).
OVERALL BIAS
OVERALL BIAS: BEARISH - ADX at 33 with −DI far above +DI, a widening bearish MACD, CMF at -0.29 and price below all key moving averages and VWAP all point to continued downside. The oversold RSI makes a relief bounce likely, but overhead resistance at $187–$189 should cap it.
This is educational analysis and not financial advice.