PLTR 20-day bearish forecast — Nov 15, 2026
- Bias: Bearish
- Timeframe: 20 days (made Nov 15, 2026, target date Dec 4, 2026)
- Price at analysis: $167.99
- Price target: $161.00
- Expected range: $152.00 – $171.50
- Result: Pending — graded after the close on Dec 4, 2026
Get a free AI analysis of PLTR today
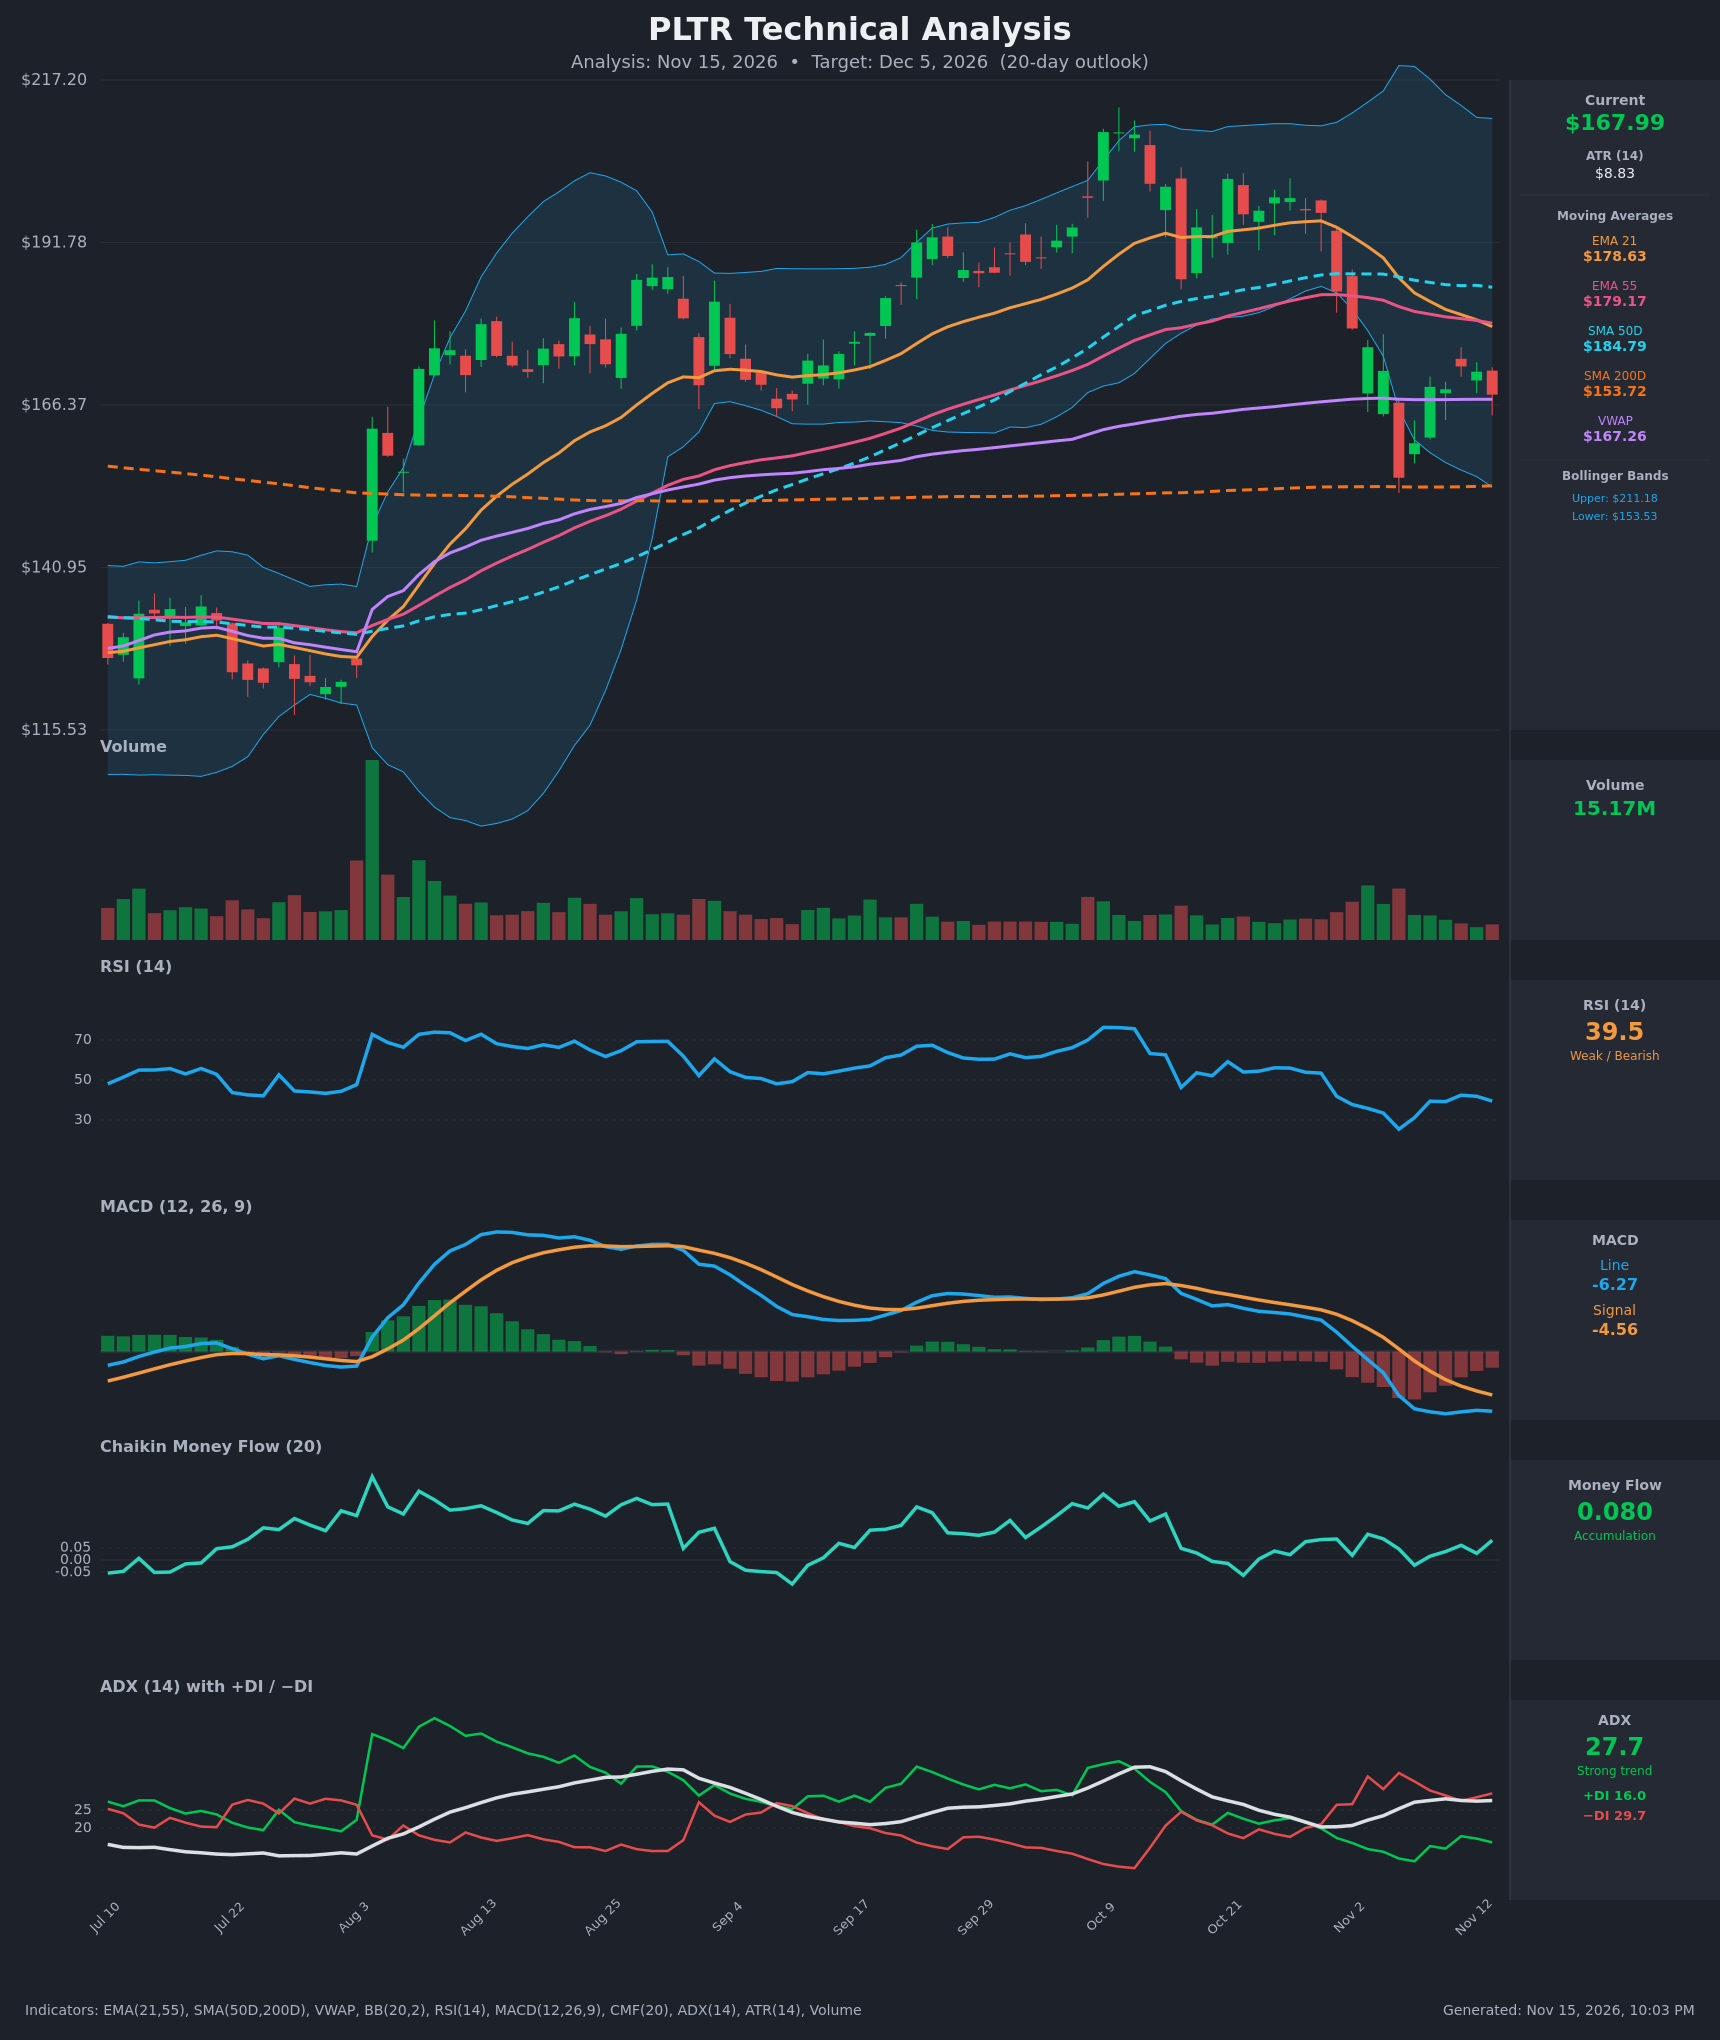
Analysis
TECHNICAL INDICATORS
- RSI (14): 39.46, below the 50 midline but above oversold. It bottomed at 25.4 on Nov 5 and bounced to 42.4 on Nov 11, then rolled over to 39.5. The failure to reclaim 50 shows bears still hold momentum, with room to fall before oversold. [Bearish]
- 20 EMA (EMA 21 = $178.63): Price at $167.99 is about 6% below it. The EMA is falling steadily (194.47 → 178.63 over 15 bars) and acts as overhead resistance. EMA21 also crossed below EMA55 ($179.17) on Nov 13, a fresh bearish crossover. [Bearish]
- MACD: Line -6.27 is below Signal -4.56 and both are below zero. The bearish crossover occurred Nov 5. The histogram is negative (about -1.7) and has stopped widening, but the line is still falling relative to the signal. This is a bearish trend with no bullish crossover yet. [Bearish]
- Bollinger Bands (20): Upper $211.18, lower $153.53, mid about $182. Price sits in the lower half, well below the midline, with the lower band and SMA200D ($153.72) clustered just underneath. The bands are wide after the volatility expansion. Price walked the lower band into the Nov 5 low and has since bounced off it. [Bearish]
- CMF (20): +0.080, above the +0.05 threshold, and it has stayed mildly positive through the sell-off. That is a divergence against the price decline: some dip buying, or at least no heavy distribution. It is the main bullish counterpoint. [Accumulation]
- ADX (14): 27.7 and rising (20.3 → 27.7), with −DI 29.7 well above +DI 16.0. The trend is strong and firmly bearish, and the DI spread is wide. [Strong Trend – Bearish]
- Volume: 15.17M, below the recent spike-day volumes. Volume was heavy on the Nov 5 capitulation leg and has been fading on the bounce. A bounce on declining volume lacks conviction. [Weak bounce / Bearish-leaning]
- Other levels: Price is essentially at VWAP ($167.26), a pivot that is not decisive. It is below SMA50D ($184.79) and above SMA200D ($153.72). The long-term uptrend is intact, but the golden cross structure is deteriorating as SMA50D flattens and turns down.
DIVERGENCES & TRENDS
- CMF vs price: CMF is positive (+0.08) while price made a lower low on Nov 5 and trades 19% below the October high. This is a bullish divergence that limits downside, but it has not yet been confirmed by price.
- RSI: It made a lower low (25.4) with price on the capitulation, but no bullish divergence is present. The bounce high at 42.4 is below the previous 50+ regime, which is bearish.
- MACD: The bearish crossover on Nov 5 is still in force, and the line is making new lows (-6.54 → -6.27, flattening slightly). The histogram contraction hints at slowing downside momentum, though not a reversal.
- Moving averages: EMA21 crossed below EMA55 on Nov 13. EMA21 is falling faster than EMA55, and price is below both. SMA50D has rolled over. No death cross is present, since SMA50D ($184.79) is far above SMA200D ($153.72). Price is above SMA200D, so the long-term trend is still up, but the intermediate trend is down.
- Trend sequence: Lower high at $198.84 (Oct 26), then $172.40 (Nov 11), and the bounce is capped well below EMA21. −DI leads +DI by about 14 points, and ADX is climbing above 25.
CHART PATTERNS
- Bearish Flag / Pennant (continuation): After the sharp Oct 29 – Nov 5 drop (from about $196 to $155), the bounce to $172 and the pullback form a small rising-to-sideways consolidation with fading volume. A break below roughly $165 would signal continuation toward $155. A full measured move would reach well below the SMA200D, but I treat that as the tail scenario.
- Bearish Double Top (reversal, already resolved): The October highs near $207 and $200 broke the neckline in the $184–$190 area, which confirmed the larger corrective trend.
- Possible Bullish Double Bottom (low probability): A retest of $155 that holds on lower volume would form a double bottom with a trigger above $172.40. It is not confirmed, so I treat it as the alternate scenario.
POTENTIAL SCENARIOS
- Scenario 1: Bearish Flag Breakdown and SMA200D Retest — The weak bounce on fading volume fails below the falling EMAs, ADX stays above 25 with −DI dominant, and price retests the $155 low and the SMA200D / lower Bollinger confluence. Trigger: close below $165 (below VWAP and the bounce low area). Target: $155–$160. Invalidation: daily close above $173 (above the Nov 11 high of $172.40). (52% probability)
- Scenario 2: Bullish Relief Rally to the Moving Averages — Positive CMF accumulation and the contracting MACD histogram drive a mean-reversion bounce toward the EMA21/55 zone, which then acts as resistance. Trigger: close above $172.40 on rising volume. Target: $178–$180. Invalidation: close below $160. (33% probability)
- Scenario 3: Neutral Range Chop — Price oscillates between SMA200D support near $155 and resistance near $173, with VWAP at $167 as the pivot. Trigger: no break of either level on closing basis. Target: $163–$171. Invalidation: close outside $155–$173. (15% probability)
PRICE TARGETS
- Target Price: $161.00 (20-day, Dec 5, 2026)
- Expected Range: $152.00 to $171.50 (width $19.50, about 11.6% of current price, consistent with the 14–21 day guidance of 8–12%)
- Key Levels: Support at $155.00 (Nov 5 low close, with SMA200D $153.72 and lower Bollinger $153.53 just below), Resistance at $172.40 (Nov 11 bounce high, with EMA21 $178.63 as the next overhead level)
OVERALL BIAS
OVERALL BIAS: BEARISH - ADX of 27.7 with −DI (29.7) far above +DI (16.0), a MACD bearish crossover below zero, a new EMA21/55 bearish cross, and price below all key short and intermediate averages with a weak, fading-volume bounce. The positive CMF and the SMA200D support near $154 argue for a limited decline rather than a collapse, so the target is a retest of the $155–$161 area.
This is educational analysis and not financial advice.