PLTR 34-day bearish forecast — Nov 15, 2026
- Bias: Bearish
- Timeframe: 34 days (made Nov 15, 2026, target date Dec 18, 2026)
- Price at analysis: $167.99
- Price target: $159.00
- Expected range: $142.00 – $178.00
- Result: Pending — graded after the close on Dec 18, 2026
Get a free AI analysis of PLTR today
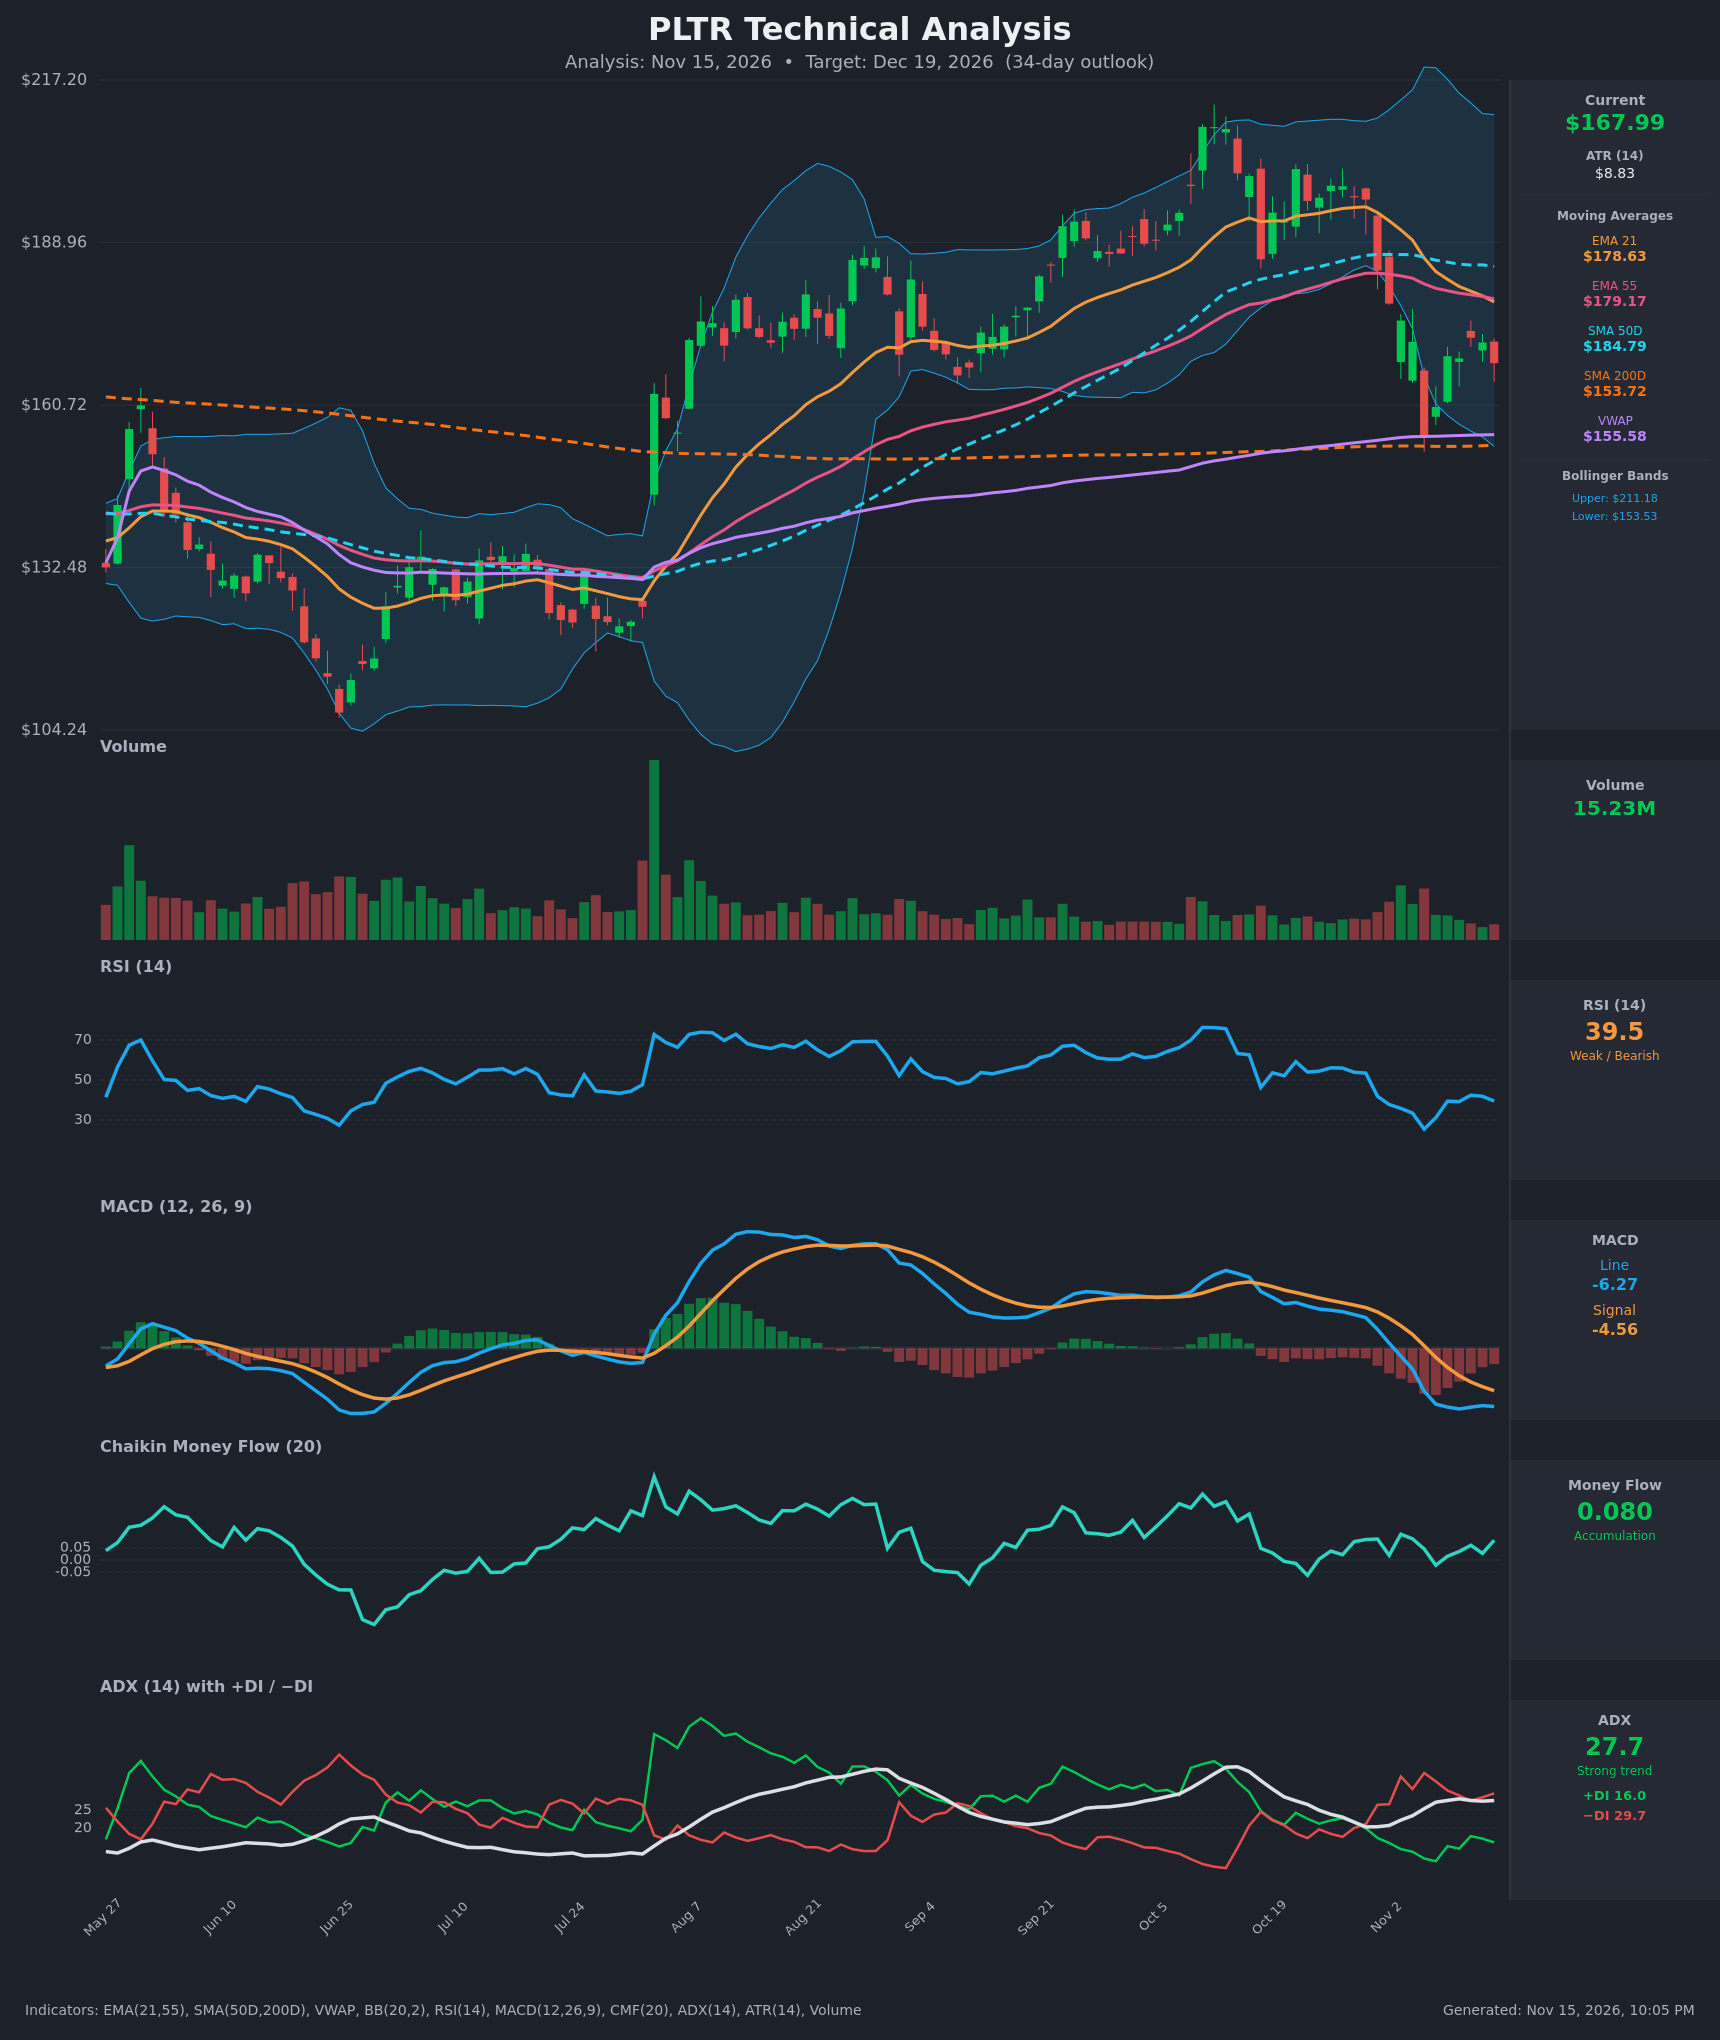
Analysis
TECHNICAL INDICATORS
- RSI (14): 39.46, below the 50 midline and recovering only slightly from the oversold 25.4 low on Nov 5. It has been stuck in the high 30s to low 40s for the past week, so the bounce is weak and has not reclaimed 50. [Bearish]
- 20 EMA: The nearest reading is the EMA 21 at $178.63, which is about 6% above price. The EMA 21 is falling steeply and has just crossed below the EMA 55 ($179.17) on Nov 13. This is a bearish crossover, and the cluster at $178–179 is overhead resistance. [Bearish]
- MACD: Line at -6.27 is below the signal at -4.56, and both are below zero. The line crossed below the signal on Nov 3 and has stayed under it. The line is now slightly lower than its Nov 10 level (-6.54 → -6.27 → -6.27 roughly flat), so there is no bullish crossover yet. The histogram is negative at about -1.7, and the gap to the signal is not narrowing meaningfully. [Bearish]
- Bollinger Bands (20): Upper $211.18, lower $153.53, midline about $182. Price at $167.99 sits in the lower half, below the midline, after tagging the lower band area on Nov 5. The bands are wide, which shows elevated volatility, but price has stepped back away from the lower band. This means it is no longer showing an extreme. [Bearish]
- CMF (20): +0.080, which is above the +0.05 threshold. It has stayed mildly positive during the bounce, so dip buyers are showing up. This is a mild offset to the otherwise bearish picture. [Accumulation]
- ADX (14): 27.7 with −DI at 29.7 on top of +DI at 16.0. ADX is above 25 and has been rising since early November, which marks a strong, established downtrend. Bears are firmly in control. [Strong Trend – Bearish]
- Volume: 15.23M on the latest bar, which is light relative to the spike on the Nov 5 breakdown. The bounce from $155 to $172 came on fading volume, which is typical of a corrective counter-trend rally rather than a true reversal. [Weak bounce – Bearish lean]
DIVERGENCES & TRENDS
- There is no clear bullish RSI or MACD divergence. The Nov 5 low of $154.99 came with an RSI of 25.4, and the later low of $167.99 is a higher price with a higher RSI (39.5). That is not a divergence, only a bounce.
- The RSI and MACD are not confirming a recovery. RSI has been rejected near 42, and MACD is flat to slightly lower.
- A death-cross-like rollover is in progress. EMA 21 just crossed below EMA 55, and SMA50D ($184.79) is falling toward the flattish SMA200D ($153.72), but it has not crossed yet.
- Price remains above the SMA200D ($153.72) and the VWAP ($155.58), so the long-term structure is intact. This is the main support layer for the bulls.
- The −DI/+DI gap is wide (29.7 vs 16.0) and ADX is rising, meaning trend strength is increasing to the downside.
- CMF remains positive, which is the one mild divergence from price. This hints at dip buying but is not strong enough to override the trend indicators.
CHART PATTERNS
- Bearish Head and Shoulders / Double Top (reversal): From August to October price formed two to three highs in the $195–$210 area. The sharp Oct 30 and Nov 5 breakdown below the 50-day SMA and the EMA cluster is consistent with a topping structure. The measured move from the roughly $205 highs to a neckline near $175–$185 implies a downside objective in the $150–$155 area, which lines up with the SMA200D and the lower band.
- Bearish Flag/Pennant (continuation): The small bounce from $155 to about $172 after the sharp drop is a low-volume consolidation. A break below $165 would act as a flag breakdown, with a measured move of roughly 12–15% from the breakdown point toward $145–$150.
- Targets: first $155 (SMA200D/VWAP/Nov 5 low), then $145–$150. The pattern is invalidated by a close back above $180.
POTENTIAL SCENARIOS
- Scenario 1: Bearish Flag Breakdown Toward the 200-Day — The weak bounce fails at the $172–$178 resistance, which is the EMA 21/55 cluster. Price rolls over and retests the Nov 5 low and the SMA200D/VWAP zone. Trigger: daily close below $164, then below $160. Target: $152–$155, with an extension to $146. Invalidation: daily close above $180. (50% probability)
- Scenario 2: Neutral Range Between the 200-Day and EMA Cluster — Price holds the $155–$156 support (SMA200D/VWAP) and bounces within a $155–$178 range. CMF accumulation supports this. Trigger: higher low above $158 with RSI back above 45. Target: $165–$175. Invalidation: close below $153 or above $180. (30% probability)
- Scenario 3: Bullish Recovery Reclaiming the Moving Averages — Dip buyers push price through the EMA 21/55 cluster, MACD crosses back above the signal, and the drop is treated as a shakeout. Trigger: close above $180 on rising volume. Target: $185–$190 (SMA50D, midline). Invalidation: failure at $185 and a drop back below $172. (20% probability)
PRICE TARGETS
- Target Price: $159.00 (34-day)
- Expected Range: $142.00 to $178.00 (width $36 = about 21.4% of the current price, in line with the 18–30% guidance for 34 days)
- Key Levels: Support at $155.00 (SMA200D/VWAP/Nov 5 low), Resistance at $178.60 (EMA 21/55 cluster)
OVERALL BIAS
OVERALL BIAS: BEARISH - The strong, rising ADX with −DI dominant, the fresh EMA 21/55 bearish cross, a negative MACD below its signal, and a low-volume bounce into overhead resistance point toward a retest of the $155 zone (SMA200D/VWAP). The main offset is positive CMF and price holding above the 200-day, which limits the downside.
This is educational analysis and not financial advice.