PLTR 48-day bearish forecast — Nov 15, 2026
- Bias: Bearish
- Timeframe: 48 days (made Nov 15, 2026, target date Jan 1, 2027)
- Price at analysis: $167.99
- Price target: $160.00
- Expected range: $138.00 – $182.00
- Result: Pending — graded after the close on Jan 1, 2027
Get a free AI analysis of PLTR today
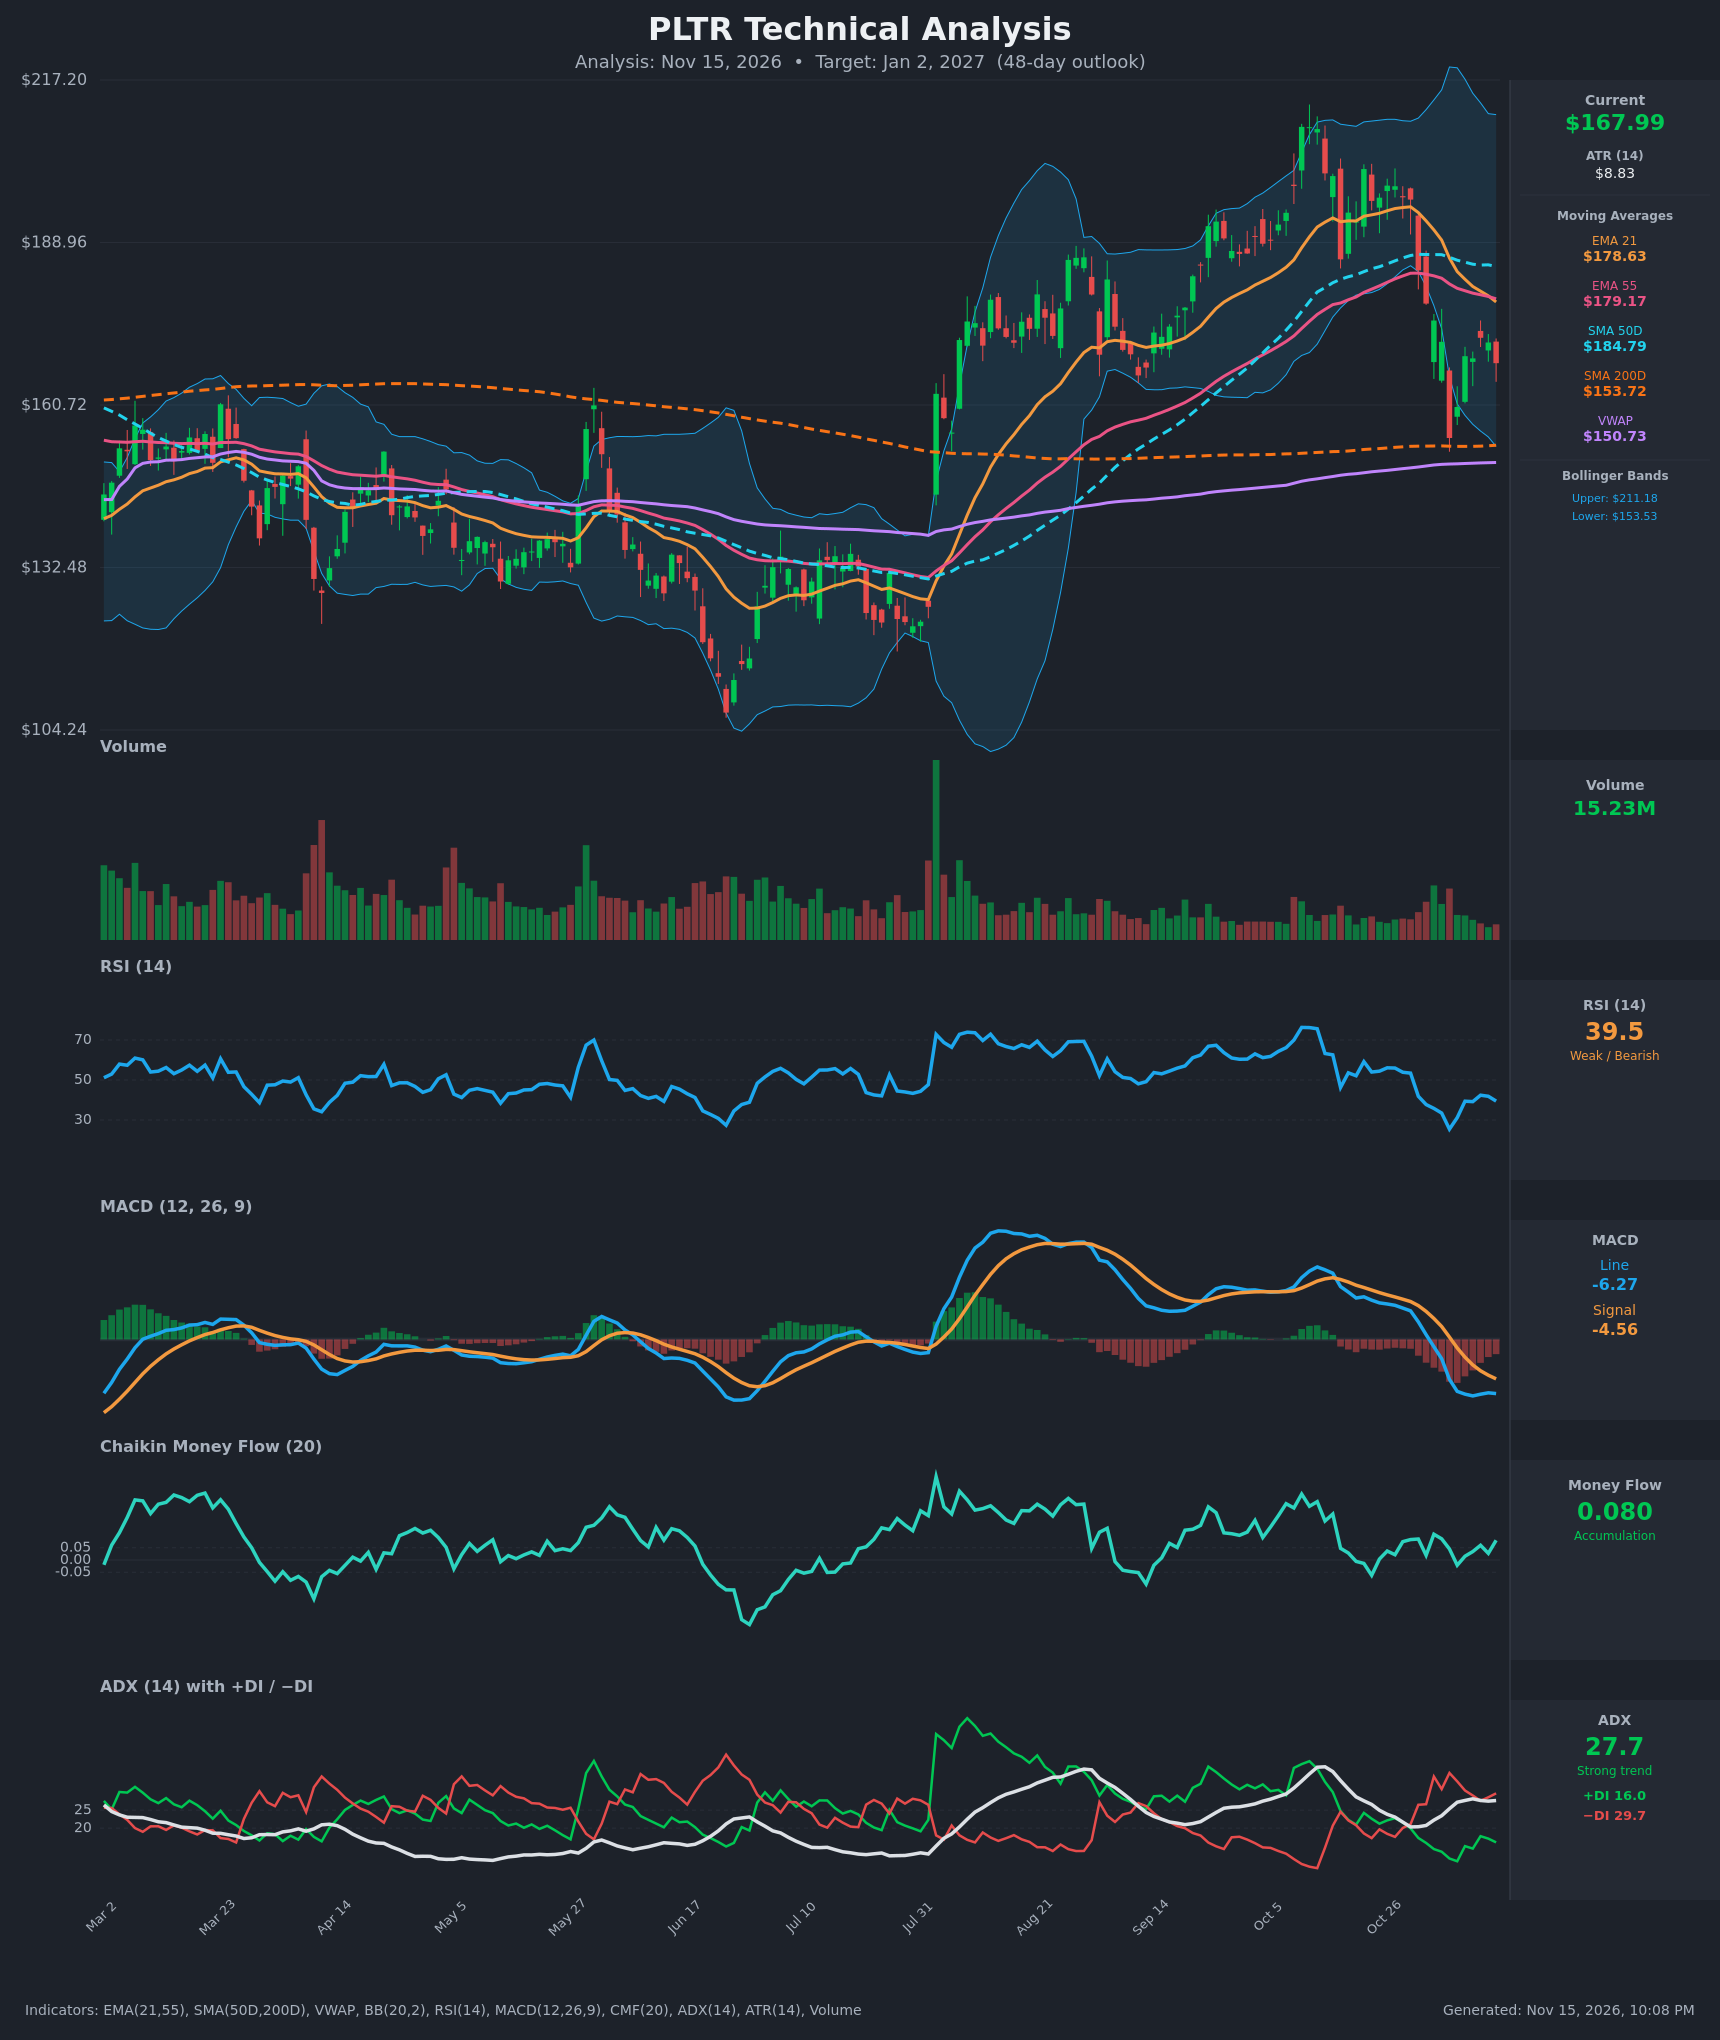
Analysis
TECHNICAL INDICATORS
- RSI (14): 39.46, rebounded from an oversold 25.4 on Nov 5 but has stalled in the low 40s and is turning down again. It remains below 50, so momentum is still weak. [Bearish]
- 20 EMA: The EMA 21 is $178.63, about 5.9% above price at $167.99. It is sloping down sharply, from $194 on Oct 28, and now acts as resistance. EMA 21 is also about to cross below EMA 55 ($179.17). [Bearish]
- MACD: The line is -6.27 and the signal is -4.56. The bearish crossover happened around Nov 3-5, and the line is now widening below the signal again, so the histogram is negative and deepening. [Bearish]
- Bollinger Bands (20): Upper is $211.18 and lower is $153.53. Price sits in the lower half, about 25% of the way up the band. The Nov 5 flush ($154.99) tested the lower band and bounced, but the bands are wide, so volatility is elevated. The middle band, around $182, is overhead resistance. [Bearish]
- CMF (20): 0.080, above +0.05, so there is mild accumulation. It has been slightly positive through the selloff, which suggests dip buying and is a mild divergence from the price drop. [Accumulation]
- ADX (14): 27.7 with −DI at 29.7 and +DI at 16.0. This is a strong trend, and the bears are clearly in control, with −DI far above +DI. ADX is rising (from 20 to 28), so the downtrend is gaining strength. [Strong Trend – Bearish]
- Volume: 15.23M, which is light compared with the spikes of earlier selloffs. The bounce from the Nov 5 low came on fading volume, so buyers are not showing strong conviction. [Neutral to Mildly Bearish]
DIVERGENCES & TRENDS
- Moving averages: Price is below EMA 21, EMA 55 and SMA 50D, which has rolled over from $186.9 to $184.8. It is still above SMA200D ($153.72) and VWAP ($150.73), so the long-term uptrend is intact but being tested. The EMA 21/55 bearish crossover is imminent (the gap is only $0.54). No death cross is present, since SMA50D remains well above SMA200D.
- Bullish divergence (minor): CMF stayed positive while price fell ~20% from the Oct 26 level. This suggests some dip buying, but it is not confirmed by price or MACD.
- Rebound failure: The RSI recovery from 25 to 42 has rolled over, and price made a lower high at $172.40 on Nov 11 below the falling EMA 21.
- Trend: The pattern of lower highs and lower lows since the Oct 26 peak near $199, with −DI dominant, points to a developing correction within the larger uptrend.
CHART PATTERNS
- Bearish Rising Wedge / Double Top (broad): The run from July to October formed a rising channel that broke down sharply on the Oct 30 and Nov 5 gap-down candles. The reference diagram's rising wedge implies a measured move back to the wedge's origin, which is the SMA200D and VWAP zone around $150-154.
- Bearish Flag (current): The Nov 6-12 bounce, from $154.99 to $172.40, is a weak, low-volume counter-trend rally inside a downtrend, resembling a bearish flag. A break below ~$165 would target roughly $145-150.
- Support: $153-155 is a double-tested zone, coinciding with the lower Bollinger Band, SMA200D and the Nov 5 low. A break of it would open the $135-140 area.
POTENTIAL SCENARIOS
- Scenario 1: Bearish Retest and Break of Support — The weak bounce fails at the EMA 21/55 cluster (~$178), and price rolls over to retest the $153-155 zone. The EMA 21/55 bearish cross and the deepening MACD support this. Trigger: close below $165 on rising volume. Target: $150-155 initially, with an extension to $140-145 if SMA200D fails. Invalidation: daily close above $180 (the EMA cluster). (45% probability)
- Scenario 2: Neutral Range Consolidation — Price stabilizes between the SMA200D zone and the declining EMAs, supported by positive CMF. Trigger: holds $155-160 with RSI stabilizing near 40-50. Target: $158-178 range. Invalidation: close below $153 or above $182. (30% probability)
- Scenario 3: Bullish Recovery to Mean — Dip buyers (CMF) push price back to the 50-day average and middle Bollinger Band. Trigger: reclaim of $179 with MACD histogram turning up. Target: $184-192. Invalidation: loss of $155. (25% probability)
PRICE TARGETS
- Target Price: $160.00 (48-day horizon, modestly below current price given the bearish trend structure, with support from the SMA200D limiting the downside)
- Expected Range: $138.00 to $182.00 (width $44, about 26% of current price, consistent with the 30-60 day guidance of 12-18% widened for PLTR's high volatility; ATR of $8.83 supports a wide range)
- Key Levels: Support at $153.70 (SMA200D and Bollinger lower band area), Resistance at $178.60 (EMA 21, with EMA 55 at $179.17 just above)
OVERALL BIAS
OVERALL BIAS: BEARISH - −DI dominates with a rising ADX, MACD is deepening below its signal, price is below the falling EMA 21, EMA 55 and SMA 50D, and the bounce looks like a weak low-volume flag. Positive CMF and the SMA200D near $154 should limit the downside, so the target is a drift toward $160 rather than a collapse.
This is educational analysis and not financial advice.