PLTR 27-day bearish forecast — Nov 15, 2026
- Bias: Bearish
- Timeframe: 27 days (made Nov 15, 2026, target date Dec 11, 2026)
- Price at analysis: $167.99
- Price target: $161.00
- Expected range: $150.00 – $176.00
- Result: Pending — graded after the close on Dec 11, 2026
Get a free AI analysis of PLTR today
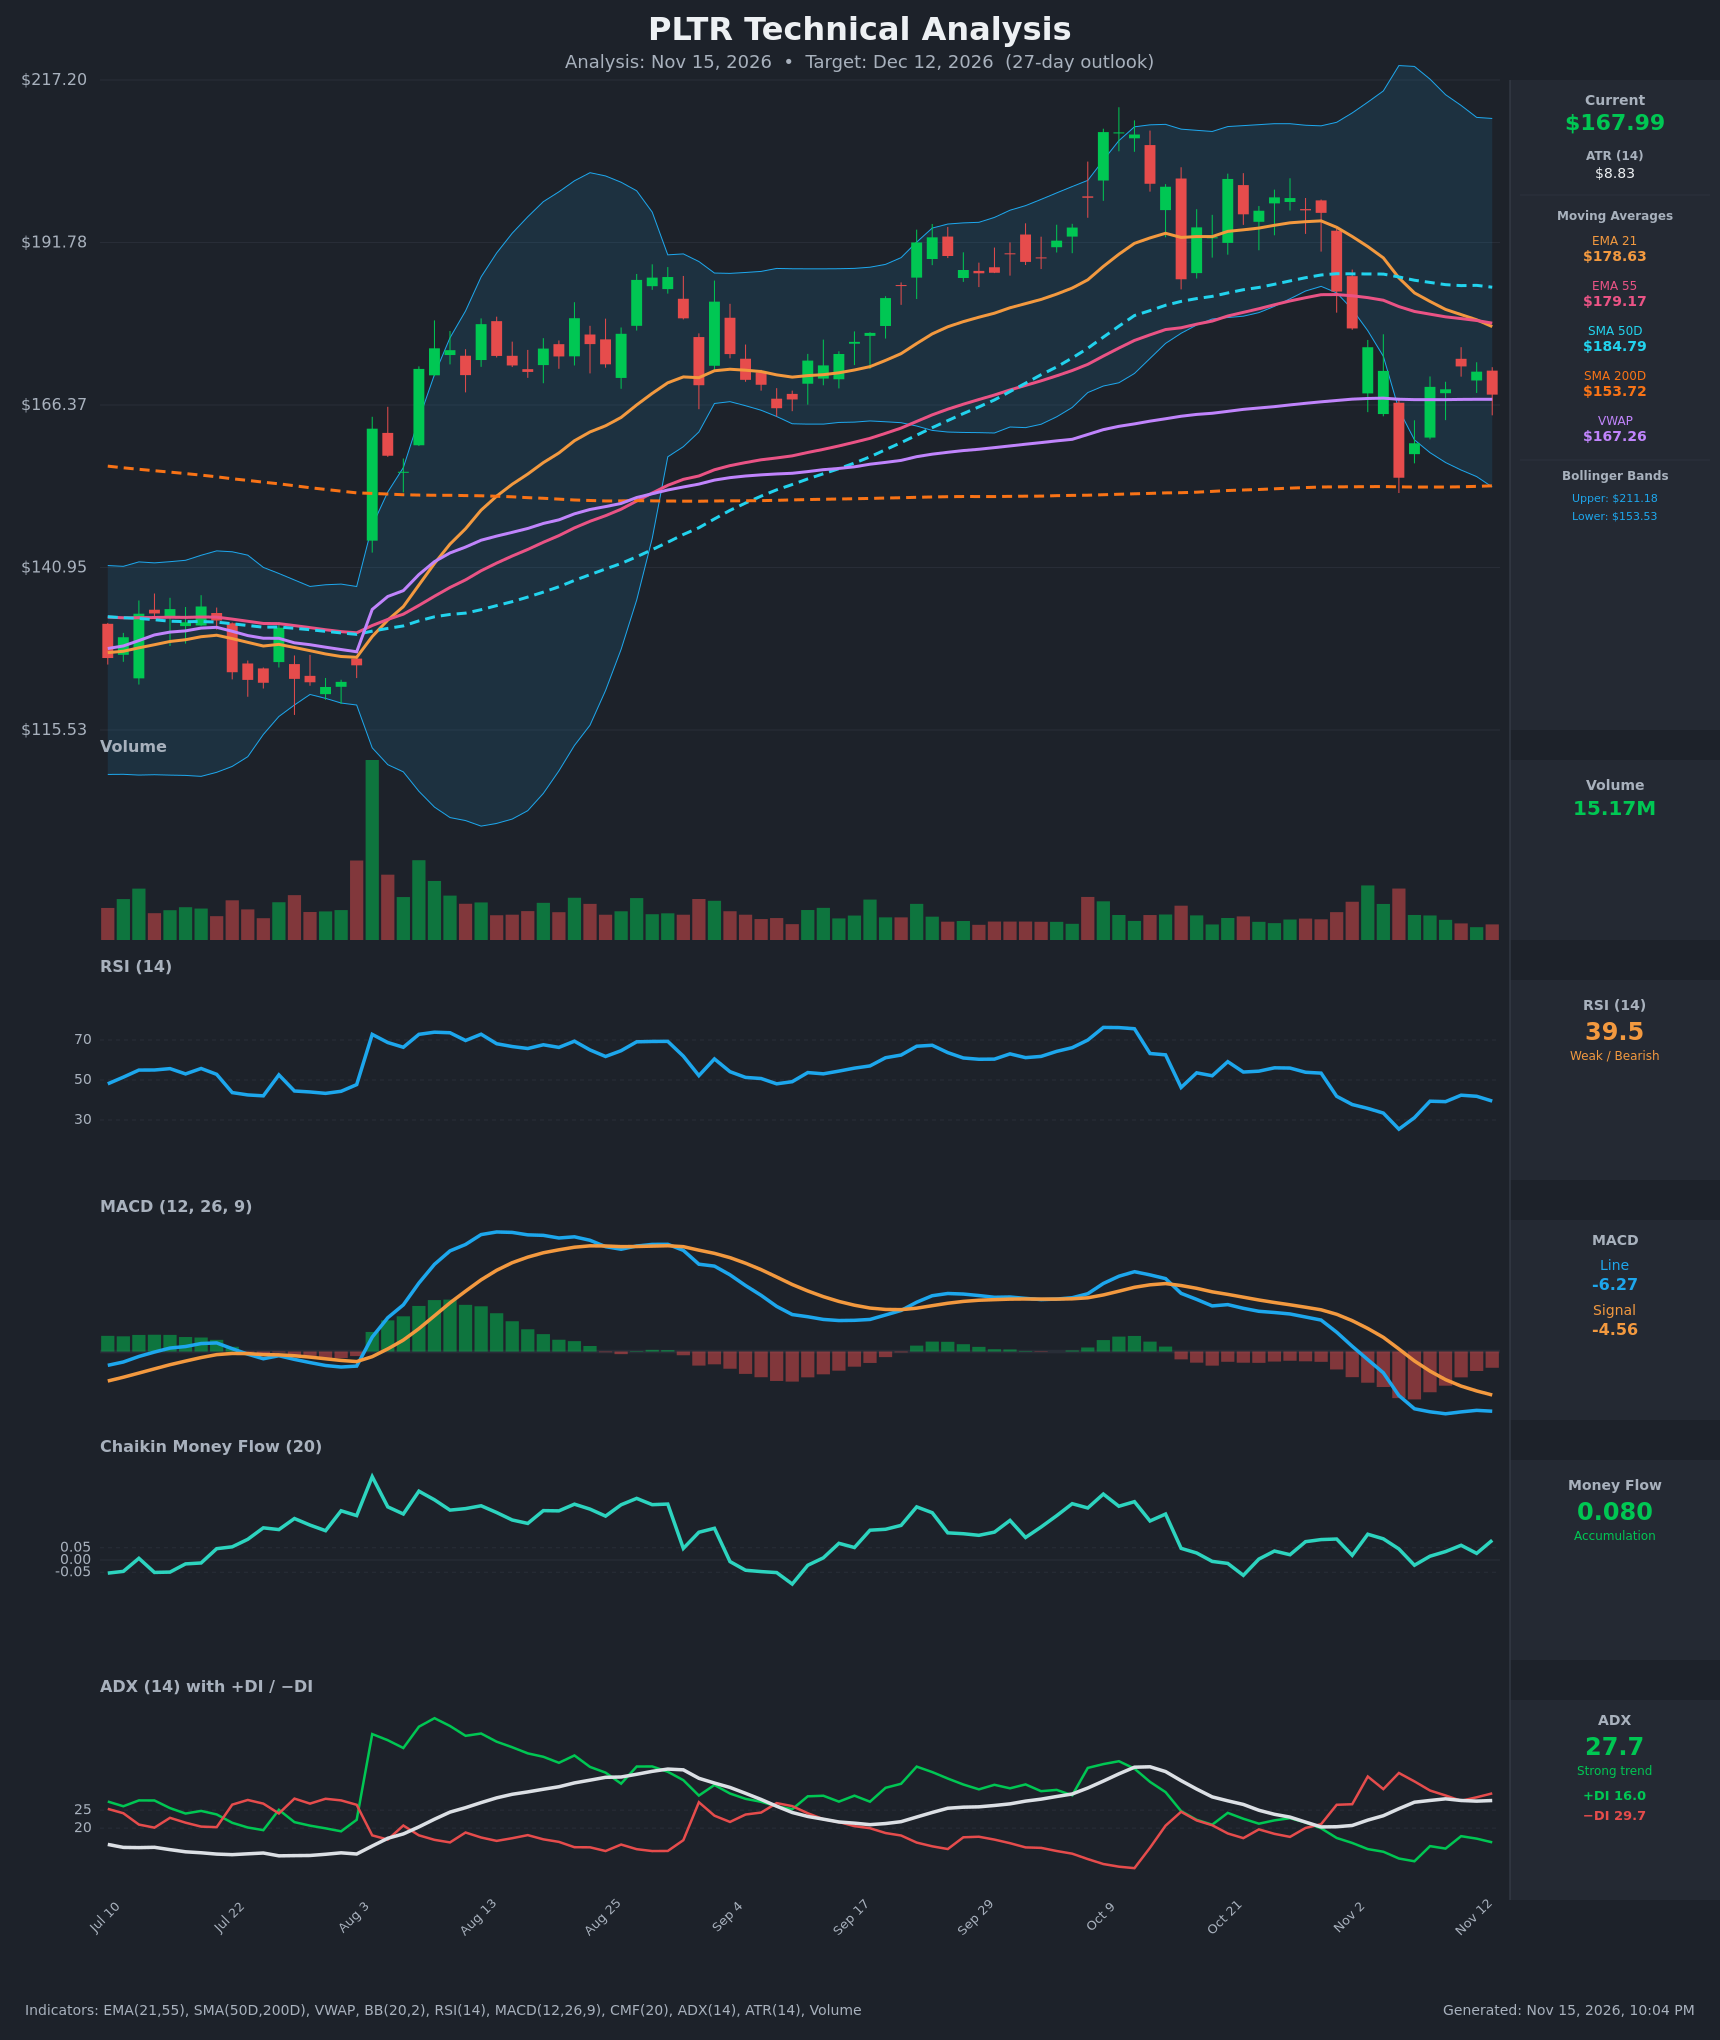
Analysis
TECHNICAL INDICATORS
- RSI (14): 39.46. It hit an oversold 25.4 on Nov 5, bounced to 42.4 on Nov 11, and has rolled over to a lower high. It sits below 50 with momentum still tilted down. [Bearish]
- 20 EMA: The 21 EMA is $178.63 and price at $167.99 is about 6% below it. The average is sloping down and acting as resistance. The 21 EMA also crossed below the 55 EMA ($179.17) on Nov 13, a fresh bearish crossover. [Bearish]
- MACD: The line (-6.27) is below the signal (-4.56) with a negative histogram of about -1.7. The bearish cross occurred around Nov 3. The line has flattened since Nov 9 but is turning down again, so there is no bullish reversal yet. [Bearish]
- Bollinger Bands (20): The bands run from $153.53 to $211.18, with the midline near $182. Price is in the lower third, about $14 above the lower band. The Nov 5 close of $154.99 tagged the lower band, and the bounce has stalled well below the midline. The bands are still wide after the earlier expansion, which allows continued volatility. [Bearish]
- CMF (20): 0.080, above the +0.05 threshold. It has held mostly positive through the pullback, which suggests dip buying and is a mild positive divergence. It is a modest reading, not a strong accumulation signal. [Accumulation]
- ADX (14): 27.7 and rising from 20, so the trend is strong. −DI (29.7) is well above +DI (16.0), so bears control the trend. [Strong Trend – Bearish]
- Volume: 15.17M, below the heavy selling bars of Oct 30 to Nov 5. The bounce came on light, fading volume, so there is no strong buying conviction. Sell-off volume was larger than recovery volume. [Neutral to Mildly Bearish]
DIVERGENCES & TRENDS
- Positive CMF divergence: price made a lower low while CMF stayed positive. This is a mild bullish offset, but it is not confirmed by price.
- RSI: a lower high (42.4 vs 56 earlier) shows weakening momentum on the bounce. There is no bullish RSI divergence.
- Moving averages: price is below the 21 EMA, 55 EMA and 50 SMA, which are stacked at $178–$185 and falling. The 21/55 EMA bearish cross is fresh. There is no death cross yet, since the SMA50 ($184.79) is still well above the SMA200 ($153.72). Price remains above the SMA200, so the long-term trend is intact.
- VWAP: price ($167.99) is almost exactly on VWAP ($167.26). This is a pivot, and a loss of it would favor sellers.
- ADX/DI: the −DI crossover on Oct 30 and the rising ADX confirm a new downtrend. +DI has been rising slowly from 10.8 to 16, but it is far from a bullish cross.
- Key confluence below: the SMA200 ($153.72), the lower Bollinger Band ($153.53) and the Nov 5 low (~$155) sit together at $153–$155.
CHART PATTERNS
- Bearish Flag / Descending Channel: after the sharp drop from ~$196 to ~$155, the bounce to $172 is a weak, low-volume corrective rally with lower highs. A breakdown projects a measured move toward the $145–$150 area, below the $153–$155 support cluster.
- Possible Bullish Double Bottom: a second successful test of $155 followed by a reclaim of $172–$178 would shift the picture. It has not been confirmed.
- Bearish Rising Wedge: this does not apply cleanly.
- Resistance zone: $178–$185 is a stack of the 21 EMA, 55 EMA and 50 SMA. Any rally into it is likely to meet supply.
POTENTIAL SCENARIOS
- Scenario 1: Bearish Lower-High Rejection and Retest of Support — The bounce fails under $172–$178, the 21/55 EMA and 50 SMA cluster keeps capping price, and the strong −DI-led trend pushes price back to the $153–$155 confluence (SMA200 and lower Bollinger Band). The 27-day outcome is a grind lower with a possible brief undercut of support. Trigger: a close below VWAP and the $165 area, then below $160. Target: $155–$160, with an extension to $148 if the SMA200 breaks. Invalidation: a daily close above $179 (EMA 21/55). (50% probability)
- Scenario 2: Bullish Support Hold and Recovery Rally — Positive CMF and the oversold RSI bounce draw dip buyers. The $153–$155 confluence holds and price reclaims the 21 EMA, then rotates toward the 50 SMA. Trigger: a close above $172.40, then above $179 on rising volume. Target: $184–$190. Invalidation: a close below $153. (30% probability)
- Scenario 3: Neutral Range Consolidation — Price chops between the $155 support and the $172–$175 resistance as ADX fades and the MACD flattens. Trigger: repeated failures at $172 and holds above $155. Target: $160–$170. Invalidation: a close outside $153–$176. (20% probability)
PRICE TARGETS
- Target Price: $161.00 (27-day horizon)
- Expected Range: $150.00 to $176.00. The width is $26, which is 15.5% of the current price and fits the 12–18% guidance for 30–60 days. It is scaled slightly narrower for 27 days.
- Key Levels: Support at $155.00 (Nov 5 close, with the SMA200 at $153.72 and the lower Bollinger Band at $153.53 just below), Resistance at $172.40 (recent swing high), with the $178.63–$184.79 moving average cluster above.
OVERALL BIAS
OVERALL BIAS: BEARISH - Price is below the 21 EMA, 55 EMA and 50 SMA. The 21 EMA has crossed under the 55 EMA, MACD is negative and below its signal, and ADX of 27.7 with −DI at 29.7 vs +DI at 16.0 confirms a strong downtrend. The low-volume bounce is a lower-high corrective rally, though positive CMF and the SMA200/lower-band support near $154 limit downside, so conviction is moderate.
This is educational analysis and not financial advice.