PLTR 62-day bearish forecast — Nov 15, 2026
- Bias: Bearish
- Timeframe: 62 days (made Nov 15, 2026, target date Jan 15, 2027)
- Price at analysis: $167.99
- Price target: $159.00
- Expected range: $138.00 – $186.00
- Result: Pending — graded after the close on Jan 15, 2027
Get a free AI analysis of PLTR today
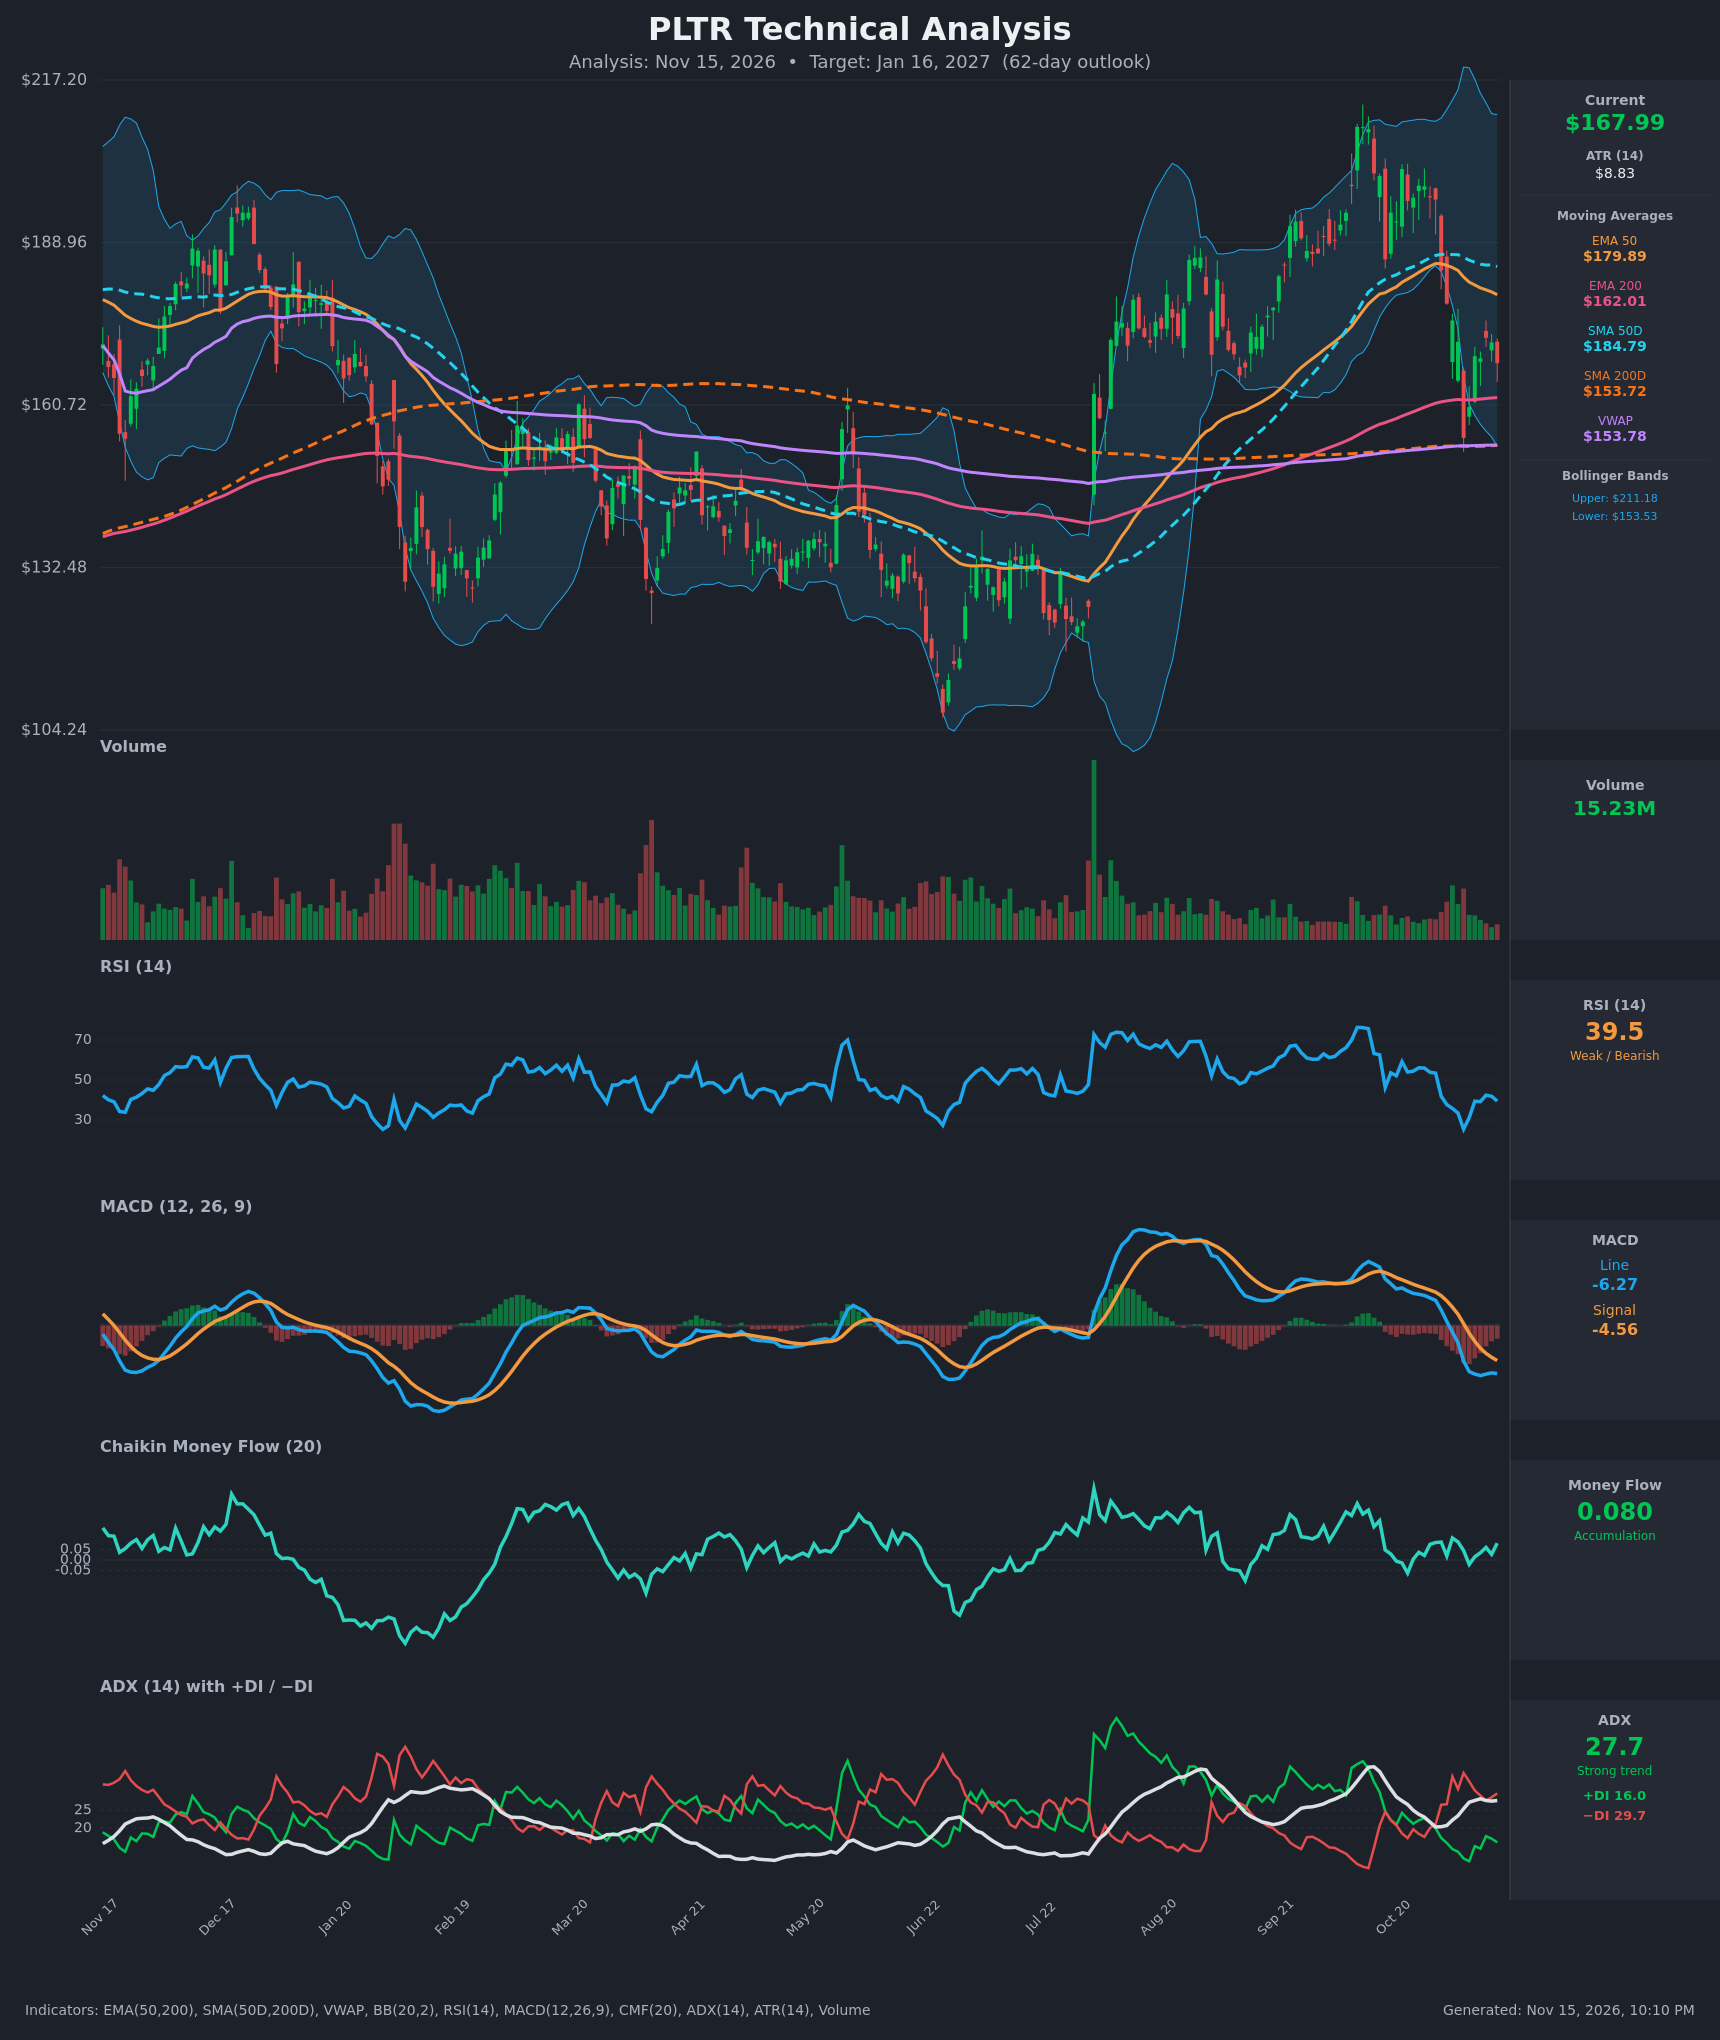
Analysis
TECHNICAL INDICATORS
- RSI (14): 39.46, below the 50 midline after falling from 56 in late October. It bottomed at 25.4 on Nov 5 (oversold) and has recovered only to the high 30s/low 40s. Momentum is weak, with no bullish reversal yet. [Bearish]
- EMA (50 / 200): The chart shows no 20 EMA, so I use the 50 and 200 EMAs. Price at $167.99 is below the EMA 50 ($179.89), which is now resistance and falling. It is above the EMA 200 ($162.01), which is the nearest support. The EMA 50 is still well above the EMA 200, so there is no bearish crossover, but the gap is narrowing. [Bearish]
- MACD: Line -6.27 is below signal -4.56, with a negative and widening histogram. It crossed bearishly around Nov 5 and stayed below zero. The line has been flat to slightly lower for several bars, so downside momentum is not accelerating. [Bearish]
- Bollinger Bands (20): Upper $211.18, lower $153.53, so the midline is about $182.4. Price sits in the lower third of the bands. The Nov 5 close at $154.99 touched the lower band and bounced. Price remains below the midline, and the bands are wide, reflecting high volatility. [Bearish]
- CMF (20): +0.080, above the +0.05 threshold, and it has stayed mostly slightly positive through the pullback. The selloff has not shown heavy distribution. This is the main divergence from the other indicators. [Accumulation]
- ADX (14): 27.7 with −DI (29.7) well above +DI (16.0). The trend is strong and bearish. ADX has been rising since 20 in late October but is flattening near 28, so the downtrend is mature. [Strong Trend – Bearish]
- Volume: 15.23M, below the average of the volume bars seen on the selloff and the Jul surge. The Nov 5 flush had a moderate volume spike. The recent bounce and consolidation are on light volume, which is not convincing for either side. [Neutral / Fading Participation]
DIVERGENCES & TRENDS
- Moving averages: SMA50D ($184.79) remains above SMA200D ($153.72), so there is no death cross. The gap is narrowing as the SMA50D rolls over. The EMA 50 and SMA50D are both declining. Price is below both and above the EMA 200 and SMA200D, so the long-term uptrend is intact while the intermediate trend is down.
- Price vs. VWAP: Price is $14 above VWAP ($153.78), and VWAP coincides with the lower Bollinger Band and the SMA200D. That makes the $153–154 zone a strong confluence of support.
- RSI: Price made a lower low on Nov 5 ($154.99). The bounce to $172 and the retest at $168 have kept RSI in the 39–42 area. This is not a divergence, just a mild stabilization.
- MACD: The bearish crossover is confirmed and the line is deeply negative, but the histogram is stabilizing.
- CMF vs. price: Price fell about 22% from the Oct high near $198, yet CMF is positive. This is a mild bullish divergence, but it is not confirmed by price or volume.
- DI: −DI crossed above +DI on Oct 29. Since then −DI has stayed 12–24 points above +DI, so bears have remained in control.
- Trend: The Nov 5 flush to $155 followed by a bounce to $172 and a lower high at $172.40 suggests a bear-flag or consolidation. Lower highs persist since $198.
CHART PATTERNS
- Rally and decline structure: From the July breakout, price rose to about $200+ in Oct, which could be a broad double-top/rounded-top reversal. It resembles the Bearish Double Top / Triple Top in the reference diagram, with the neckline in the $155–160 area. A break below the neckline projects a measured move of roughly $40, toward $115–120, but that would require a close below the $153–154 support confluence.
- Current consolidation: The $155–172 bounce is shaped like a Bearish Flag/Pennant (a sharp drop followed by a small, drifting consolidation). The breakdown target is a flagpole-length move, in this case toward the $140s.
- Counter-case: Price is holding above the 200-day averages, similar to the wide-ranging pullbacks of Feb and Jun. If $153 holds, a Bullish Double Bottom with the Nov 5 low is possible, but it needs a break above $172–180 to confirm.
POTENTIAL SCENARIOS
- Scenario 1: Bearish Breakdown Toward the 200-Day Zone — Failure at the EMA 50/SMA50D resistance and a retest of the lower Bollinger Band. ADX stays elevated with −DI dominant, and MACD stays negative. Trigger: close below $160 and then $153.5. Target: $140–150, with an extension to about $135 if $153 breaks decisively. Invalidation: daily close above $180. (45% probability)
- Scenario 2: Neutral Range Between the 200-Day and 50-Day Averages — Price chops between the $153–154 support confluence and the $175–180 resistance. CMF accumulation limits downside while falling EMA 50 caps rallies. Trigger: holds above $155 on tests with RSI stabilizing in the 40s. Target: $160–175. Invalidation: close below $153 or above $182. (25% probability)
- Scenario 3: Bullish Recovery and Reclaim of the 50-Day Averages — The Nov 5 low acts as a double bottom, CMF accumulation proves right, and price reclaims $180. Trigger: close above $180 with a MACD bullish crossover. Target: $195–205. Invalidation: close below $153. (30% probability)
PRICE TARGETS
For the 62-day horizon (to about Jan 16, 2027), the guidance is a range width of about 18–30% of current price. My range is $138.00 to $186.00, a width of $48 or about 28.6%. The target is modestly below the current price, reflecting the bearish trend, but the support confluence and long-term uptrend limit the downside.
- Target Price: $159.00 (62-day)
- Expected Range: $138.00 to $186.00
- Key Levels: Support at $153.50 (SMA200D / lower Bollinger Band / VWAP confluence), Resistance at $179.89 (EMA 50)
OVERALL BIAS
OVERALL BIAS: BEARISH - Price is below the falling EMA 50 and SMA50D with a bearish MACD crossover, −DI far above +DI with ADX near 28, and RSI under 40. Positive CMF and the $153 support cluster limit the downside, so the target is a modest drift toward $159.
This is educational analysis and not financial advice.