PLTR 83-day bearish forecast — Nov 15, 2026
- Bias: Bearish
- Timeframe: 83 days (made Nov 15, 2026, target date Feb 5, 2027)
- Price at analysis: $167.99
- Price target: $158.00
- Expected range: $140.00 – $180.00
- Result: Pending — graded after the close on Feb 5, 2027
Get a free AI analysis of PLTR today
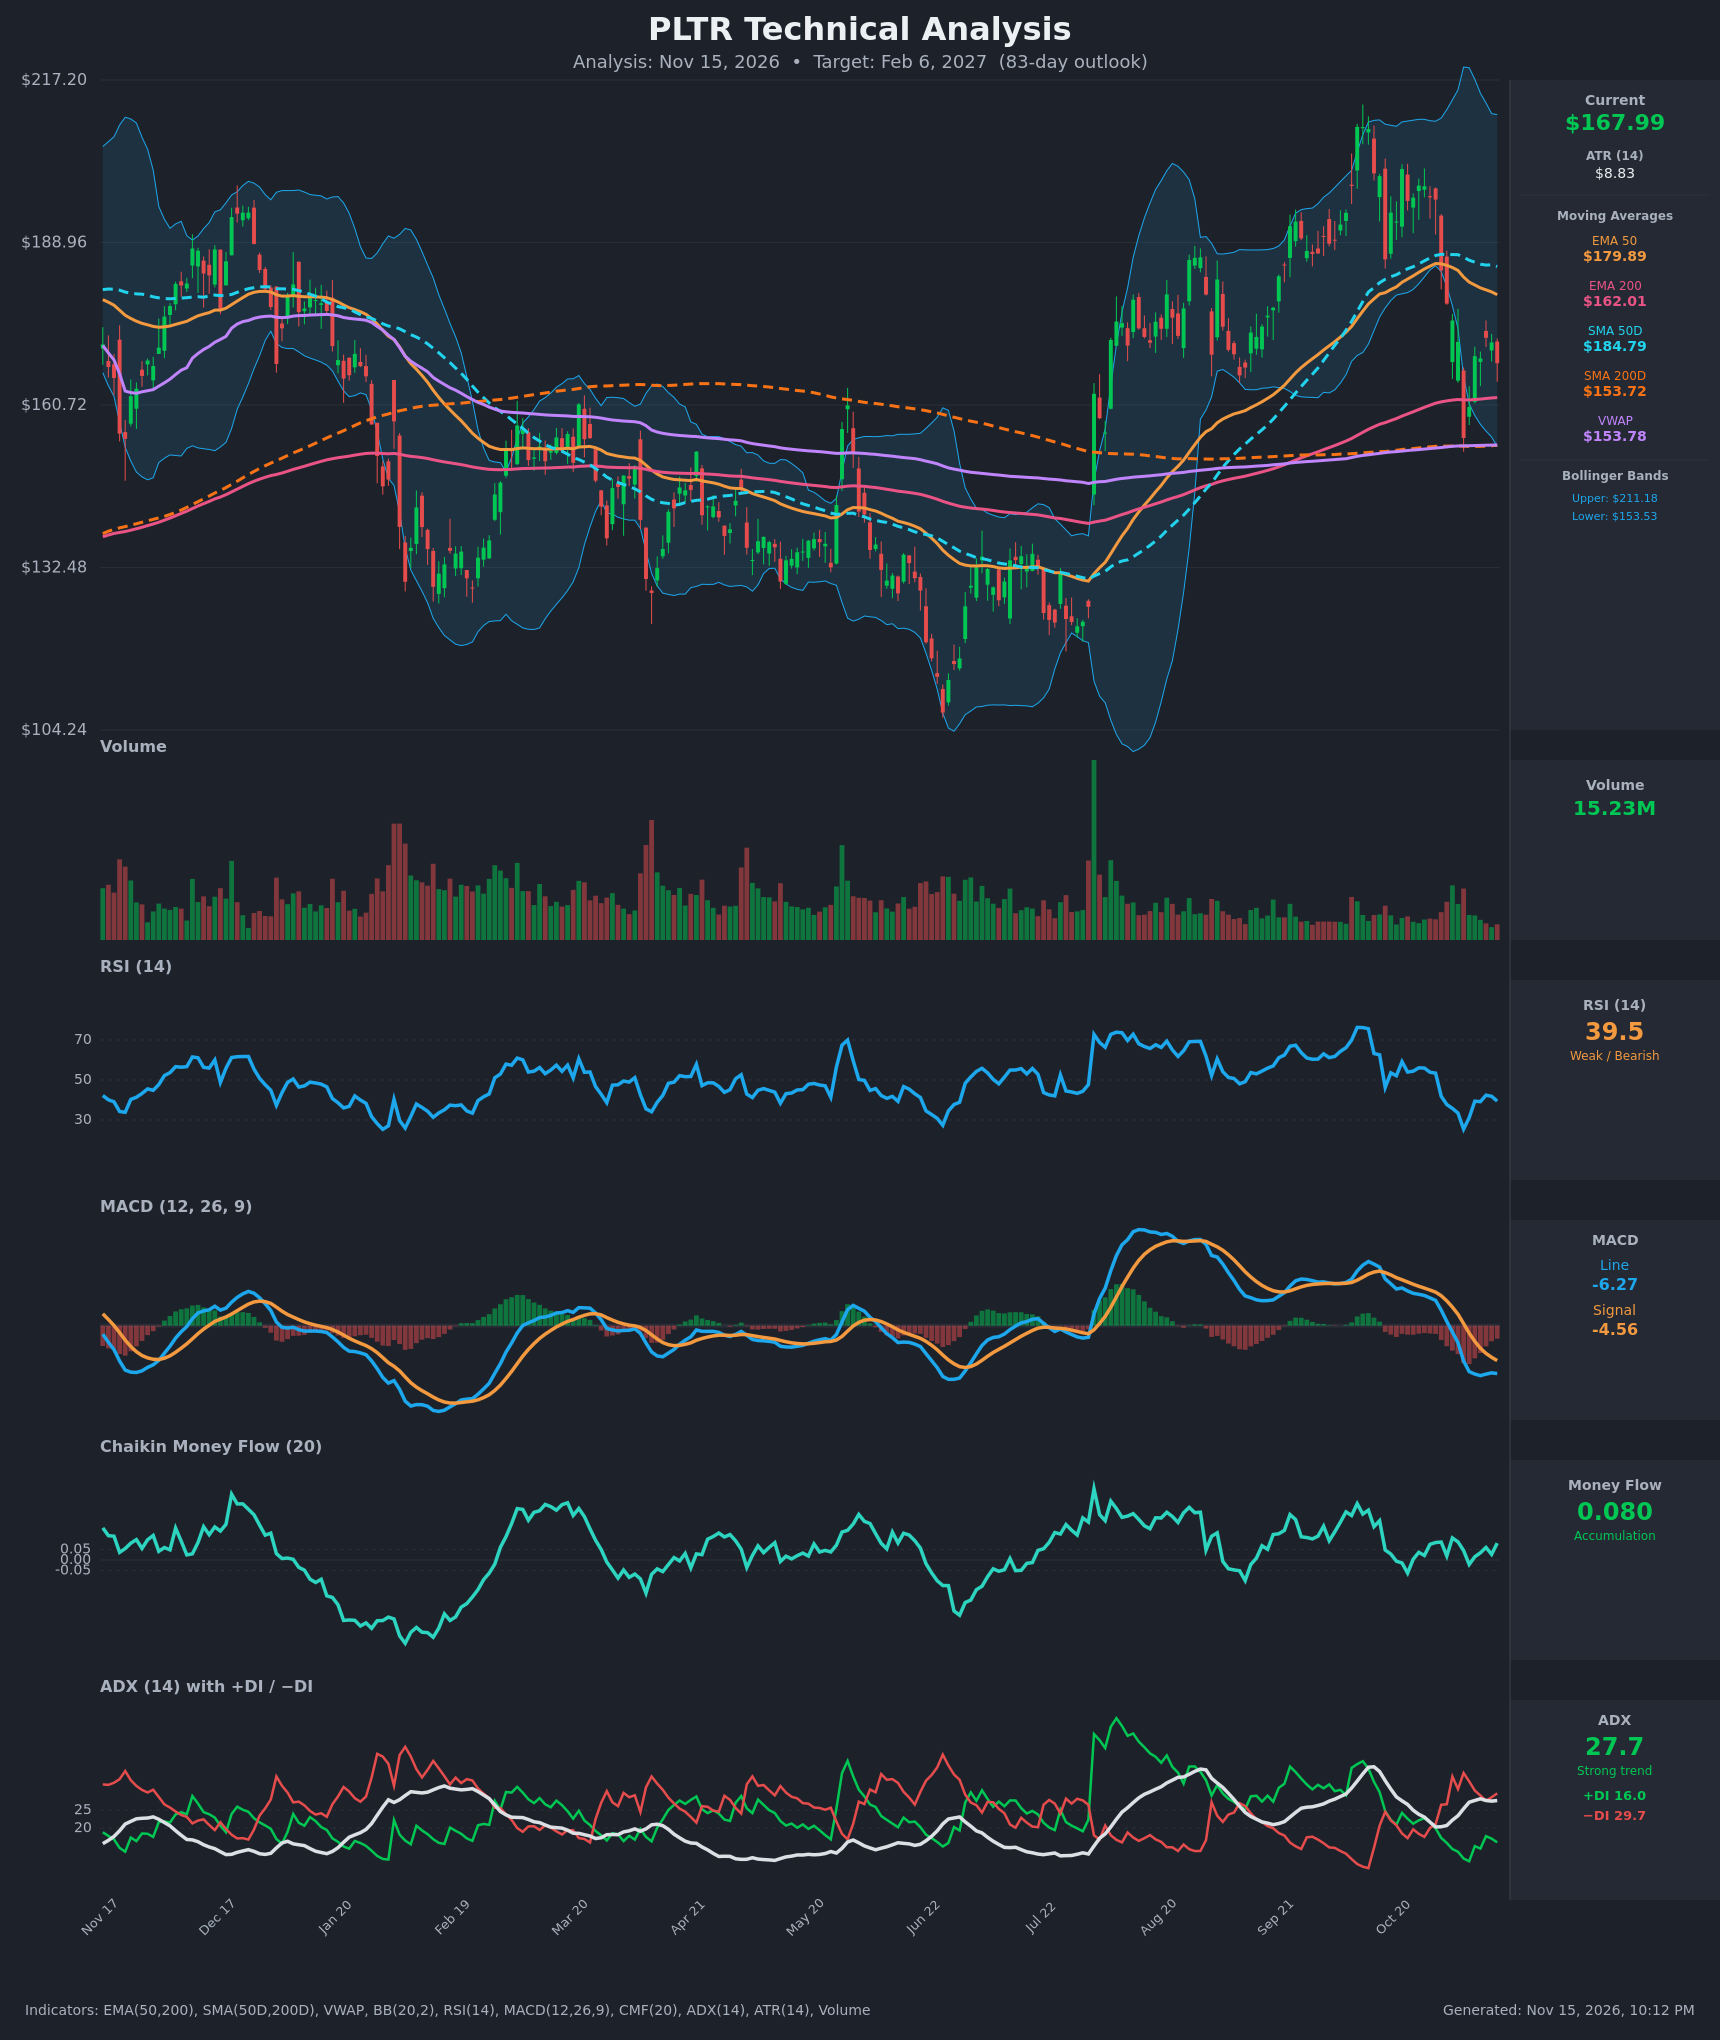
Analysis
TECHNICAL INDICATORS
- RSI (14): 39.46. It bounced from an oversold 25.4 on Nov 5 to about 42, then rolled over again. It is below 50 and has made no new high on the bounce. Momentum is weak but not oversold. [Bearish]
- 20 EMA: No 20 EMA is supplied, so I use the EMA 50 at $179.89, which is falling. Price at $167.99 is about 6.6% below it, and it acts as overhead resistance. Price is still above the EMA 200 ($162.01), the nearest support. [Bearish]
- MACD: Line -6.27 is below signal -4.56, a histogram of about -1.70. The bearish crossover happened on Nov 5 and both lines are below zero. The line is flattening, so downside momentum is stabilising but has not turned. [Bearish]
- Bollinger Bands (20): Upper $211.18, lower $153.53, midline roughly $182. Price sits in the lower third, about $14 above the lower band. The bands are wide after the October volatility. The Nov 5 low pierced the lower band, and the bounce has failed to reclaim the midline. [Bearish]
- CMF (20): +0.080, above the +0.05 threshold and positive for most of the recent bars despite the sell-off. Dip buying or accumulation is present, which is a mild counterweight to the price weakness. [Accumulation]
- ADX (14): 27.7 and rising from about 20 in late October, so a trend is established. −DI (29.7) is well above +DI (16.0), and the bears took control with the Oct 30 DI crossover. [Strong Trend – Bearish]
- Volume: 15.23M, modest compared with the large spikes earlier in the year. The bounce from the Nov 5 low came on light volume, so there is no strong conviction from buyers. [Neutral to Bearish]
DIVERGENCES & TRENDS
- Price vs RSI: No clear divergence. The RSI low of 25.4 on Nov 5 was not confirmed by a deeper price low, but the RSI has since failed to climb above about 42. That is a weak relief bounce.
- MACD trend: MACD crossed below signal on Nov 5 and has stayed below it. The gap is stabilising (-6.27 vs -4.56), so selling pressure is easing, but there is no bullish cross yet.
- Moving averages: Price fell below the EMA 50 and SMA 50 (about $184.79) in the Oct 30 to Nov 5 drop. EMA 50 has crossed back toward EMA 200 but is still above it, and SMA 50 is still above SMA 200. There is no death cross, but the spread is narrowing. Price is above the EMA 200 ($162.01) and SMA 200 ($153.72), so the long-term structure is intact. This is the key tension in the chart.
- VWAP: Price is above VWAP ($153.78), and VWAP sits close to the SMA 200 and the lower Bollinger Band, which makes the $153–154 zone a strong confluence of support.
- CMF vs price: CMF stays positive while price falls, a mild bullish divergence. It is not enough on its own to override the DI and MACD readings.
- Trend structure: The summer-to-October rally peaked near $210 and has reversed sharply. Lower highs are forming ($198.8 → $172.4).
CHART PATTERNS
- Bearish Flag Pattern (continuation): The Nov 5 flush ($196 → $155) was followed by a tight, slightly upward-drifting consolidation around $168–$172. A break below about $165 would project a measured move toward the $130s, though that is the extreme end of the range. A more conservative target is the $153 confluence zone.
- Broken rising channel / Bearish Rising Wedge-like top: The Jul–Oct advance made a rounded top with a rising channel. The break of the lower channel and the EMA 50 confirms a reversal in the near term.
- Support cluster: EMA 200 ($162), SMA 200 ($153.7), VWAP ($153.8) and the lower Bollinger Band ($153.5) form a strong floor. If it holds, a larger consolidation or base can form. A break would turn the pattern into a deeper reversal toward the $130 area, the previous range low.
POTENTIAL SCENARIOS
- Scenario 1: Bearish Flag Breakdown and Test of Support — Price fails to reclaim the EMA 50, the bear flag resolves lower, and sellers (−DI dominant, ADX above 25) push price through the EMA 200 into the $153–$155 confluence zone. Trigger: daily close below $162. Target: $153–$155, with an extension to about $142 if that fails. Invalidation: daily close above $180 (EMA 50). (45% probability)
- Scenario 2: Bullish Support Hold and Recovery — Price holds the EMA 200 and the $153 confluence, positive CMF accumulation continues, and the MACD crosses back up. Price retraces toward the midline and the falling EMA/SMA 50 area. Trigger: close above $172.5 with rising volume. Target: $180–$188. Invalidation: close below $153. (35% probability)
- Scenario 3: Neutral Range Chop — Price oscillates between the EMA 200 and the EMA 50 for the full period as the ADX fades. Trigger: ADX falling below 20 with RSI back near 50. Target: $160–$175. Invalidation: close outside $153–$182. (20% probability)
PRICE TARGETS
- Target Price: $158.00 (83 days, about -5.9% from current)
- Expected Range: $140.00 to $180.00 (width $40, about 23.8% of the current price, consistent with the 61–180 day guidance of 18–30%)
- Key Levels: Support at $162.01 (EMA 200), with deeper support at $153.70. Resistance at $179.89 (EMA 50), with further resistance near $184.79 (SMA 50).
OVERALL BIAS
OVERALL BIAS: BEARISH - ADX at 27.7 with −DI far above +DI, a bearish MACD below signal, an RSI below 50 and price under the falling EMA/SMA 50 all favour a drift lower toward the $153–$162 support cluster. Positive CMF and the intact long-term moving averages limit the downside, so conviction is moderate.
This is educational analysis and not financial advice.