PLTR 6-day bearish forecast — Nov 1, 2026
- Bias: Bearish
- Timeframe: 6 days (made Nov 1, 2026, target date Nov 6, 2026)
- Price at analysis: $184.10
- Price target: $180.50
- Expected range: $177.00 – $188.50
- Result: Correct (-12.7%) — closed at $160.65 on Nov 6, 2026; quality score 50/100
Get a free AI analysis of PLTR today
Analysis
TECHNICAL INDICATORS
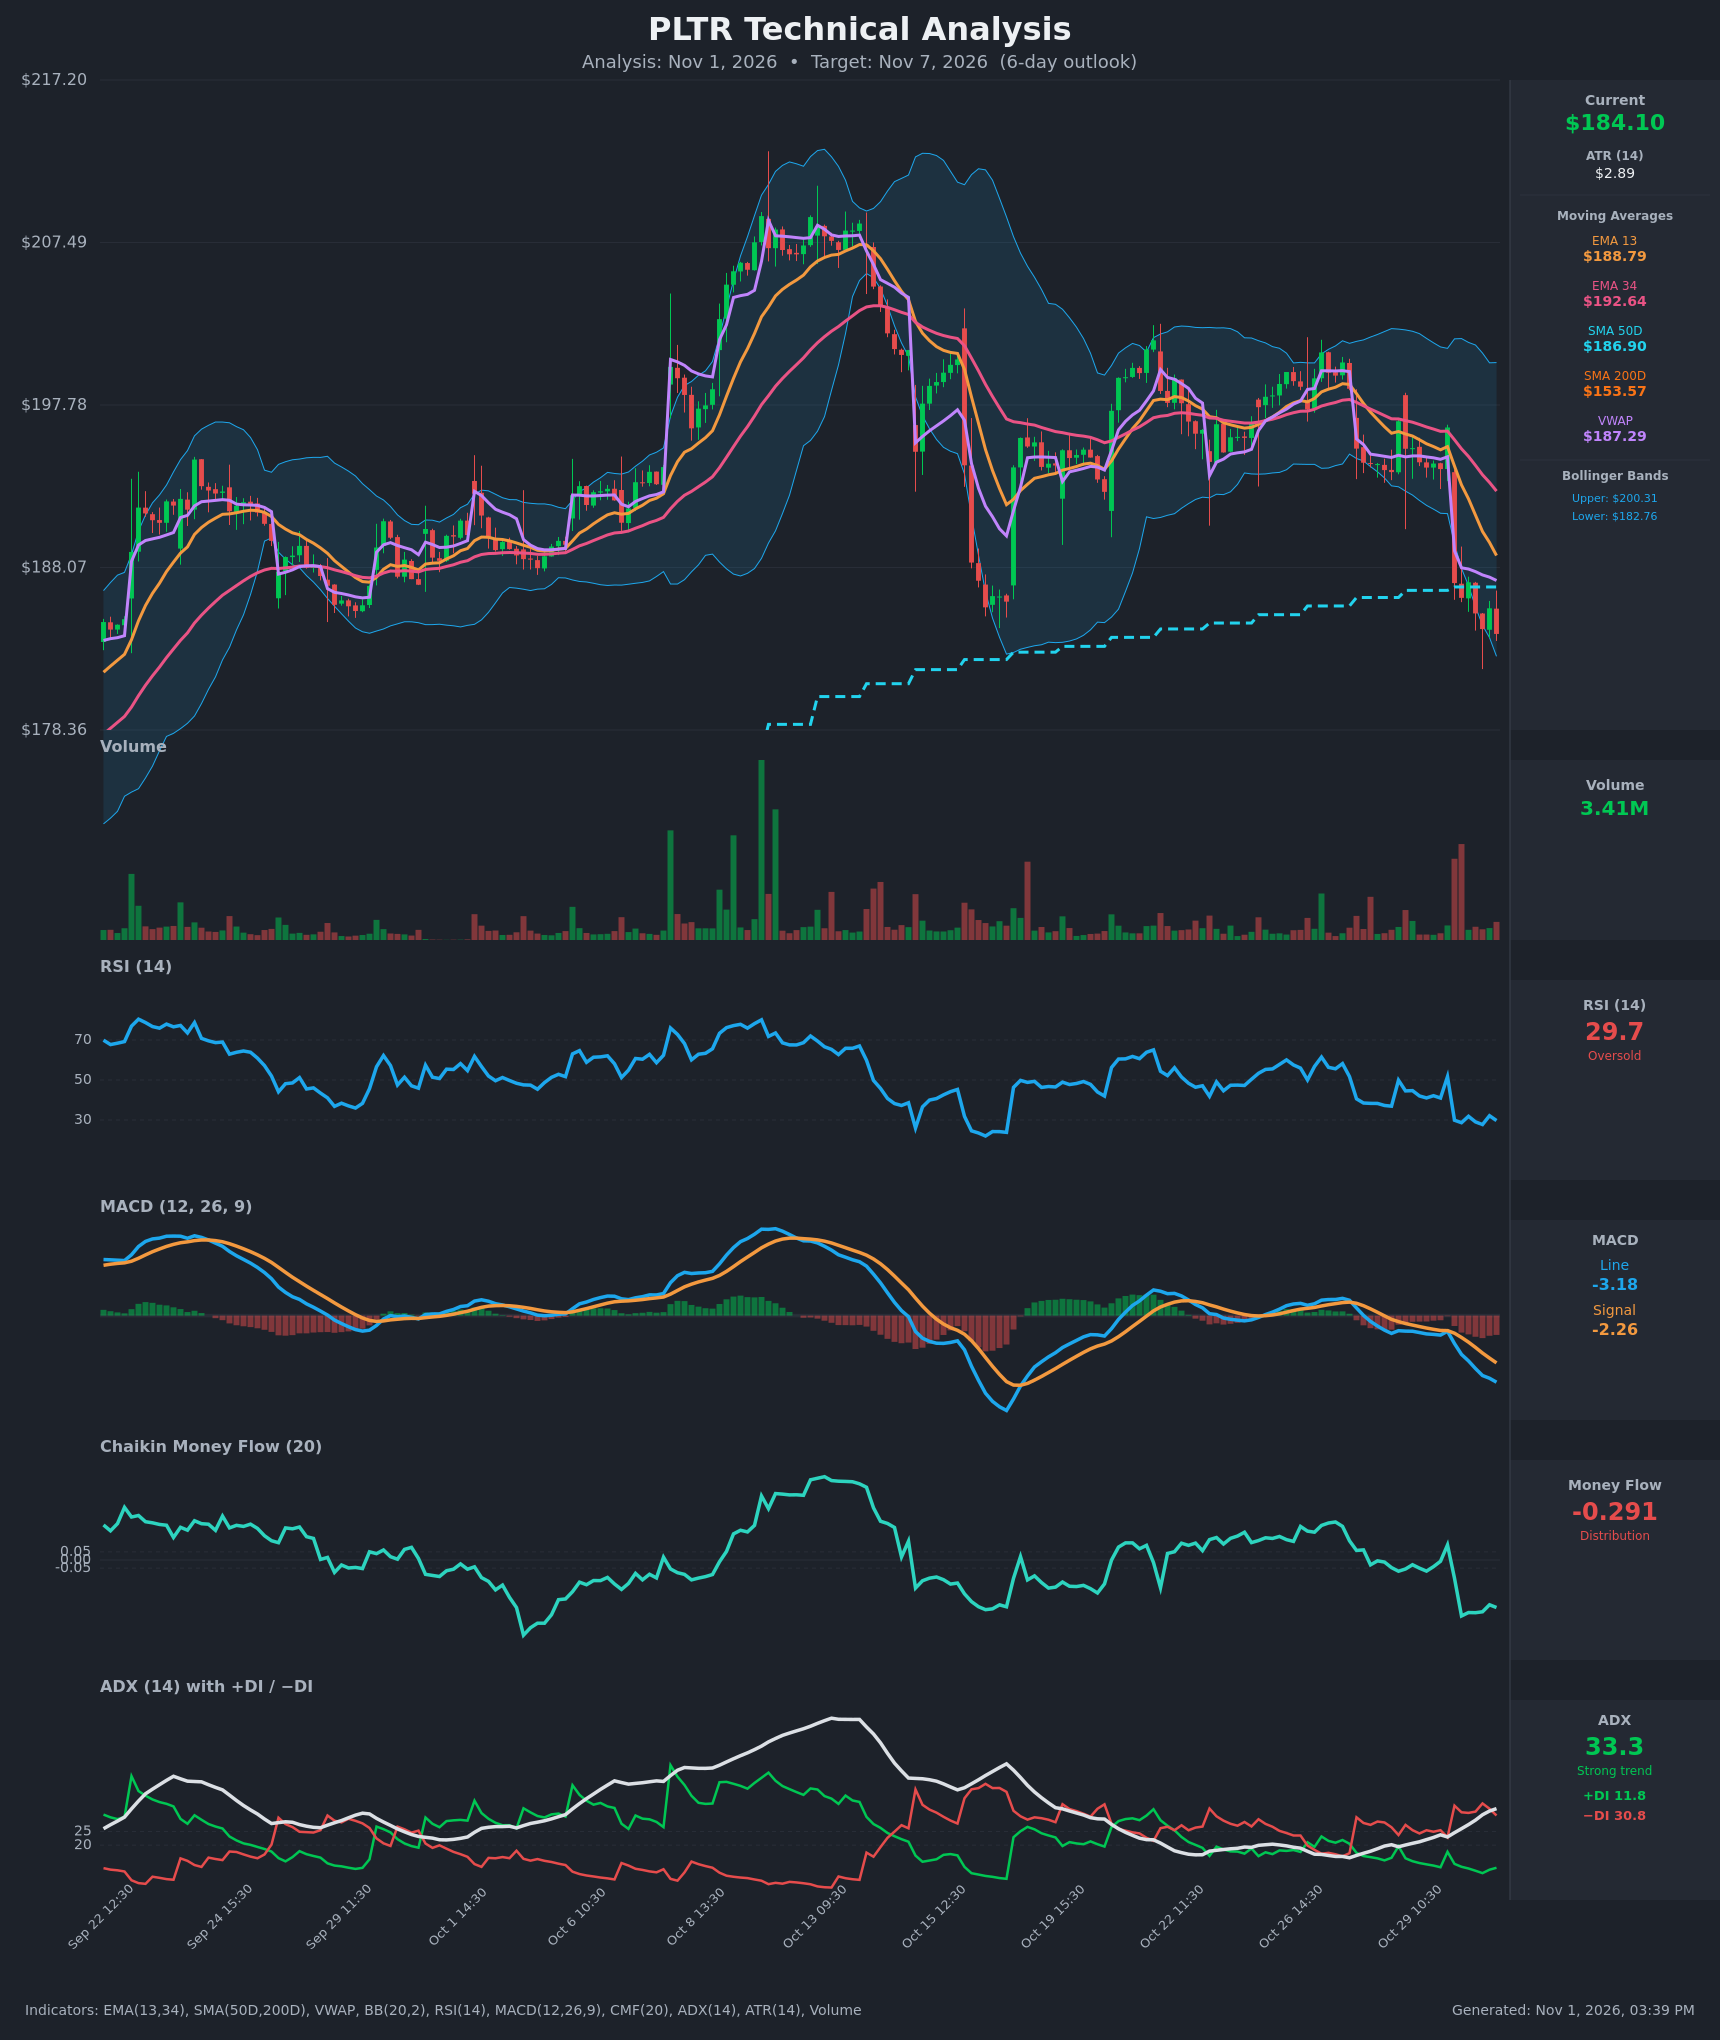
- RSI (14): 29.73, oversold and down from about 51 two sessions ago. It has stayed in the 28–32 zone since the Oct 30 gap down. Oversold readings in a strong downtrend can persist, though they raise the odds of a relief bounce. [Neutral]
- 20 EMA (EMA 13 / EMA 34 used): EMA 13 is $188.79 and EMA 34 is $192.64. Price at $184.10 is below both, and EMA 13 is below EMA 34 (bearish alignment). Both are falling and act as overhead resistance. [Bearish]
- MACD: The line is -3.18 against a signal of -2.26, a bearish crossover that has been widening for about 8 bars. The histogram is about -0.92 and still expanding, so downside momentum has not yet turned. [Bearish]
- Bollinger Bands (20): The upper band is $200.31 and the lower is $182.76. Price at $184.10 is hugging the lower band in the bottom 8% of the range. The bands are wide after the gap-down expansion, so a walk down the band or a snap-back toward the mid-band (about $191.5) are both possible. [Neutral]
- CMF (20): -0.291, well below the -0.05 threshold. It fell from about +0.09 to -0.34 in two sessions and has not recovered, which shows heavy, persistent selling pressure. [Distribution]
- ADX (14): 33.3 and rising from 19 to 33 in two days. −DI (30.8) is far above +DI (11.8), so bears are firmly in control of a strong downtrend. [Strong Trend – Bearish]
- Volume: 3.41M. The Oct 30 gap-down session had the heaviest volume in weeks and the selling bars were red, which is distribution. The latest bar's volume is lower, so some selling exhaustion is possible but not confirmed. [Bearish with early exhaustion signs]
DIVERGENCES & TRENDS
- There is no bullish RSI or MACD divergence yet. RSI is making lows in line with price, and MACD is still making new lows, so momentum confirms the decline.
- The Oct 30 session gapped from $196.44 to $187.14 and then drifted lower to $184.10. This is a sequence of lower highs and lower lows on the hourly chart.
- Price is below VWAP ($187.29), SMA 50 ($186.90), EMA 13 and EMA 34. Every short-term average has flipped to resistance.
- The −DI/+DI spread is wide (about 19 points) and ADX is rising, which points to trend continuation rather than exhaustion.
- Price is still well above SMA 200 ($153.57), so the long-term trend is intact. SMA 50 is above SMA 200, so there is no death cross. This favors a correction within an uptrend rather than a full reversal.
- The last bar did not make a significantly lower low on RSI, which hints at a possible short-term bounce toward $187–189.
CHART PATTERNS
- The Oct 19–29 price action formed a rectangle/range between about $191 and $200. It broke down on heavy volume, similar to a Bearish Triple Top / range breakdown from the reference diagram. The measured move (range height of about $8–9 projected from about $192) points to about $183–184, which price has already largely reached.
- Further downside therefore needs fresh momentum. The next support is the $178–180 zone, the bottom of the chart range.
- The break below the rising SMA 50 (now at $186.90, with the dashed line on the chart) is bearish. A failed reclaim of that level would confirm the breakdown.
- There is no confirmed reversal pattern such as a double bottom or falling wedge. Price is only sitting at the lower Bollinger Band.
POTENTIAL SCENARIOS
- Scenario 1: Bearish Trend Continuation — Strong ADX, −DI dominance, negative CMF and an expanding MACD histogram suggest sellers keep control, with a likely stall near the $178–180 zone. Trigger: a hourly close below the lower band ($182.76). Target: $178.50–$181. Invalidation: a close above $187 (SMA 50/VWAP). (50% probability)
- Scenario 2: Bullish Oversold Relief Bounce — RSI is below 30 and price sits at the lower band, so a mean-reversion bounce toward the declining moving averages is plausible. Trigger: a reclaim of $186 with improving volume and a CMF uptick. Target: $188.80–$191 (EMA 13, VWAP and SMA 50 cluster). Invalidation: a rejection at $187–189 and a fall back below $182.76. (38% probability)
- Scenario 3: Neutral Base Building — Price chops sideways as selling exhausts and buyers do not yet commit. Trigger: tight hourly ranges between $182 and $187 on declining volume. Target: $183–$186. Invalidation: a close outside $181–$188. (12% probability)
PRICE TARGETS
- Target Price: $180.50 (6-day, about -2.0% from $184.10)
- Expected Range: $177.00 to $188.50 (width $11.50, about 6.2% of the current price, in line with the 4–8% guidance for 7–10 days and scaled slightly lower for 6 days)
- Key Levels: Support at $182.76 (lower Bollinger Band, with $178.36 as the secondary chart low), Resistance at $186.90 (SMA 50, with VWAP at $187.29 just above)
OVERALL BIAS
OVERALL BIAS: BEARISH - A strong, rising ADX with −DI far above +DI, a widening MACD bearish crossover, CMF at -0.29 and price below every key moving average outweigh the oversold RSI. Rallies should meet resistance at $186.90–$188.79, though a relief bounce is a real risk given the oversold condition.
This is educational analysis and not financial advice.