GOOGL 6-day bearish forecast — Nov 1, 2026
- Bias: Bearish
- Timeframe: 6 days (made Nov 1, 2026, target date Nov 6, 2026)
- Price at analysis: $279.76
- Price target: $275.00
- Expected range: $265.50 – $286.00
- Result: Incorrect (+2.0%) — closed at $285.41 on Nov 6, 2026; quality score 42/100
Get a free AI analysis of GOOGL today
Analysis
TECHNICAL INDICATORS
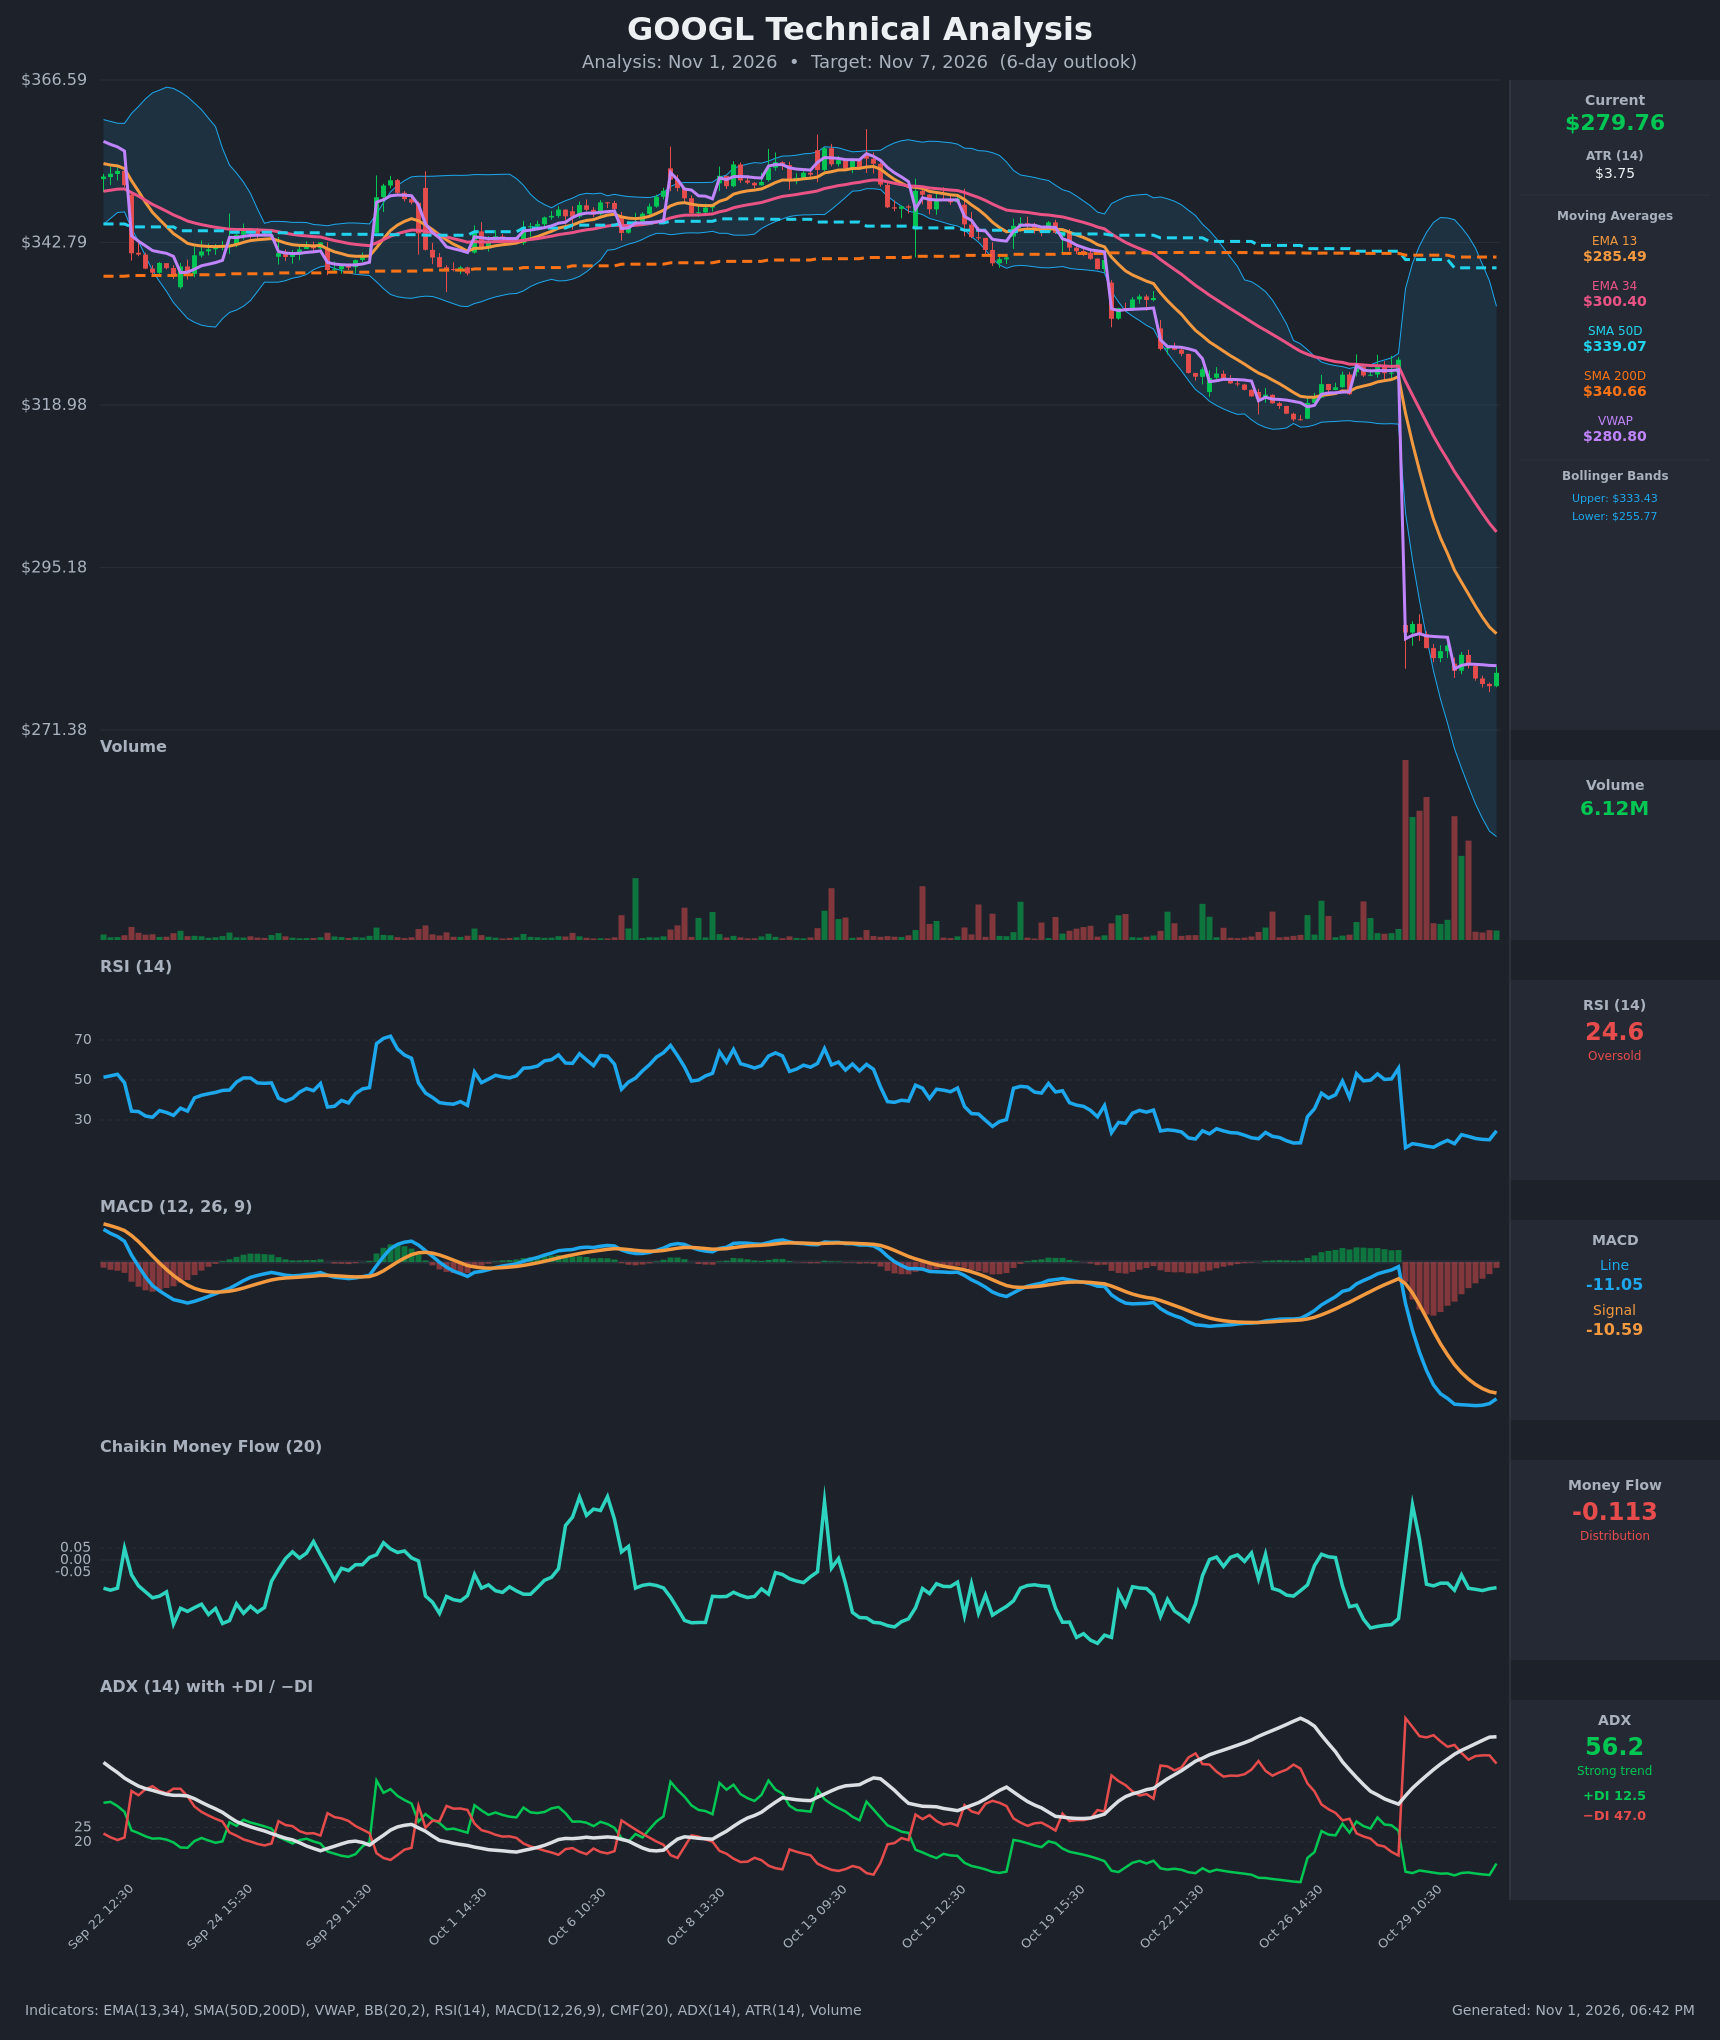
- RSI (14): 24.6, deeply oversold. It has hooked up from a 16-20 range, so downside momentum is easing, but it is still below 30 and has not yet confirmed a reversal. [Neutral]
- 20 EMA: The data provides EMA 13 ($285.49) and EMA 34 ($300.40). Price at $279.76 is below both, and both are falling steeply. EMA 13 sits about 2% overhead and is the first resistance. [Bearish]
- MACD: The line (-11.05) is still below the signal (-10.59), but the gap has narrowed to about -0.46. The line has turned up from -11.6 and is on the verge of a bullish crossover, though both lines are deeply negative. This is a momentum-stabilization signal, not a trend reversal. [Neutral]
- Bollinger Bands (20): Bands are $255.77 to $333.43 and very wide after the gap. Price is in the lower third of the bands and has not touched the lower band, so the extreme is not exhausted. The midline is around $294, well above price. [Bearish]
- CMF (20): -0.113, below -0.05. It has been mostly negative across the move, with a brief positive spike at the gap-day capitulation volume. The post-gap readings show persistent selling pressure. [Distribution]
- ADX (14): 56.2 and rising, with -DI (47.0) far above +DI (12.5). This is a very strong, established downtrend, though +DI has just ticked up from 8.6 to 12.5. [Strong Trend - Bearish]
- Volume: 6.12M on the latest bar, a fraction of the huge gap-day volume (the chart's largest bars). Volume has dried up during the post-gap drift, so selling has cooled even though price keeps grinding lower. [Fading selling pressure, no capitulation confirmation]
Other context:
- VWAP: $280.80 (anchored from the gap). Price is slightly below it, so it acts as minor resistance.
- SMA 50D/200D: $339.07 and $340.66, with price far below both. The 50D is already below the 200D, a long-standing bearish alignment, and both are about 21% overhead.
DIVERGENCES & TRENDS
- There is no confirmed bullish RSI divergence. RSI printed 16.4-20 on the early lows and 24.6 now, but price made a lower low from $281.91 to $277.80. This is an early, tentative improvement in momentum.
- The MACD histogram is shrinking from its deeply negative extreme, which signals decelerating downside. The bullish line/signal crossover is imminent but not yet confirmed.
- EMA 13 is far below EMA 34 and the SMAs, with no recovery crossover in sight. The 50D is below the 200D (death-cross regime).
- ADX is high and rising with -DI dominant, which is a trend-continuation signal. A +DI/-DI cross is nowhere near.
- Post-gap price action is a slow downward grind in a tight $277-$287 band, with lower highs and lower lows on declining volume.
CHART PATTERNS
- Bearish Pennant / Bearish Flag (continuation): After the sharp gap-down "pole" from about $325 to $285, price has consolidated in a narrow, slightly descending band. This matches the reference diagram's bearish flag/pennant, which typically resolves lower. The measured-move target from a ~$40 pole is far lower (about $240-$245), but that is beyond a 6-day horizon, so only a partial move is likely.
- Counter-view: A small base or double-bottom attempt is possible near $277-$278 (the Oct 30 lows of $277.80 and $278.12). A close above about $287 would invalidate the bearish flag and open a bounce toward $295-$300 (gap-fill zone and EMA 34).
POTENTIAL SCENARIOS
- Scenario 1: Bearish Flag Breakdown / Continued Drift — The post-gap consolidation resolves in the direction of the dominant trend (ADX 56, -DI 47, CMF negative, below all MAs). Sellers push through the $277-$278 low and probe the lower half of the band. Trigger: Hourly close below $277.80 with rising volume. Target: $271-$273, with an extension to about $265. Invalidation: Close above $287 (EMA 13/prior swing high). (45% probability)
- Scenario 2: Bullish Oversold Relief Bounce — RSI near 24, a MACD bullish crossover and fading volume trigger short covering and mean reversion. Price reclaims VWAP and EMA 13 but stays well below the declining EMA 34. Trigger: Close above VWAP ($280.80) and then $286.90 with a MACD crossover. Target: $290-$295. Invalidation: Loss of $277 on a closing basis. (38% probability)
- Scenario 3: Neutral Sideways Basing — Price chops in the $277-$287 band as the market digests the gap. Trigger: No close beyond either edge of the band. Target: $278-$284. Invalidation: Hourly close outside $277-$287. (17% probability)
PRICE TARGETS
- Target Price: $275.00 (6-day horizon, about 1.7% below current)
- Expected Range: $265.50 to $286.00 (width $20.50, about 7.3% of the current price, consistent with the 7-10 day guidance scaled for 6 days)
- Key Levels: Support at $271.50, Resistance at $285.50 (EMA 13; VWAP at $280.80 is minor resistance)
OVERALL BIAS
OVERALL BIAS: BEARISH - A very strong downtrend (ADX 56, -DI 47 vs +DI 12.5), price below every moving average, negative CMF and a bearish flag/pennant after the gap-down point to continued downside. Oversold RSI (24.6) and a near MACD crossover make a relief bounce a real risk, so conviction is modest.
This is educational analysis and not financial advice.