GOOGL 27-day bearish forecast — Nov 15, 2026
- Bias: Bearish
- Timeframe: 27 days (made Nov 15, 2026, target date Dec 11, 2026)
- Price at analysis: $295.77
- Price target: $288.00
- Expected range: $268.00 – $314.00
- Result: Pending — graded after the close on Dec 11, 2026
Get a free AI analysis of GOOGL today
Analysis
TECHNICAL INDICATORS
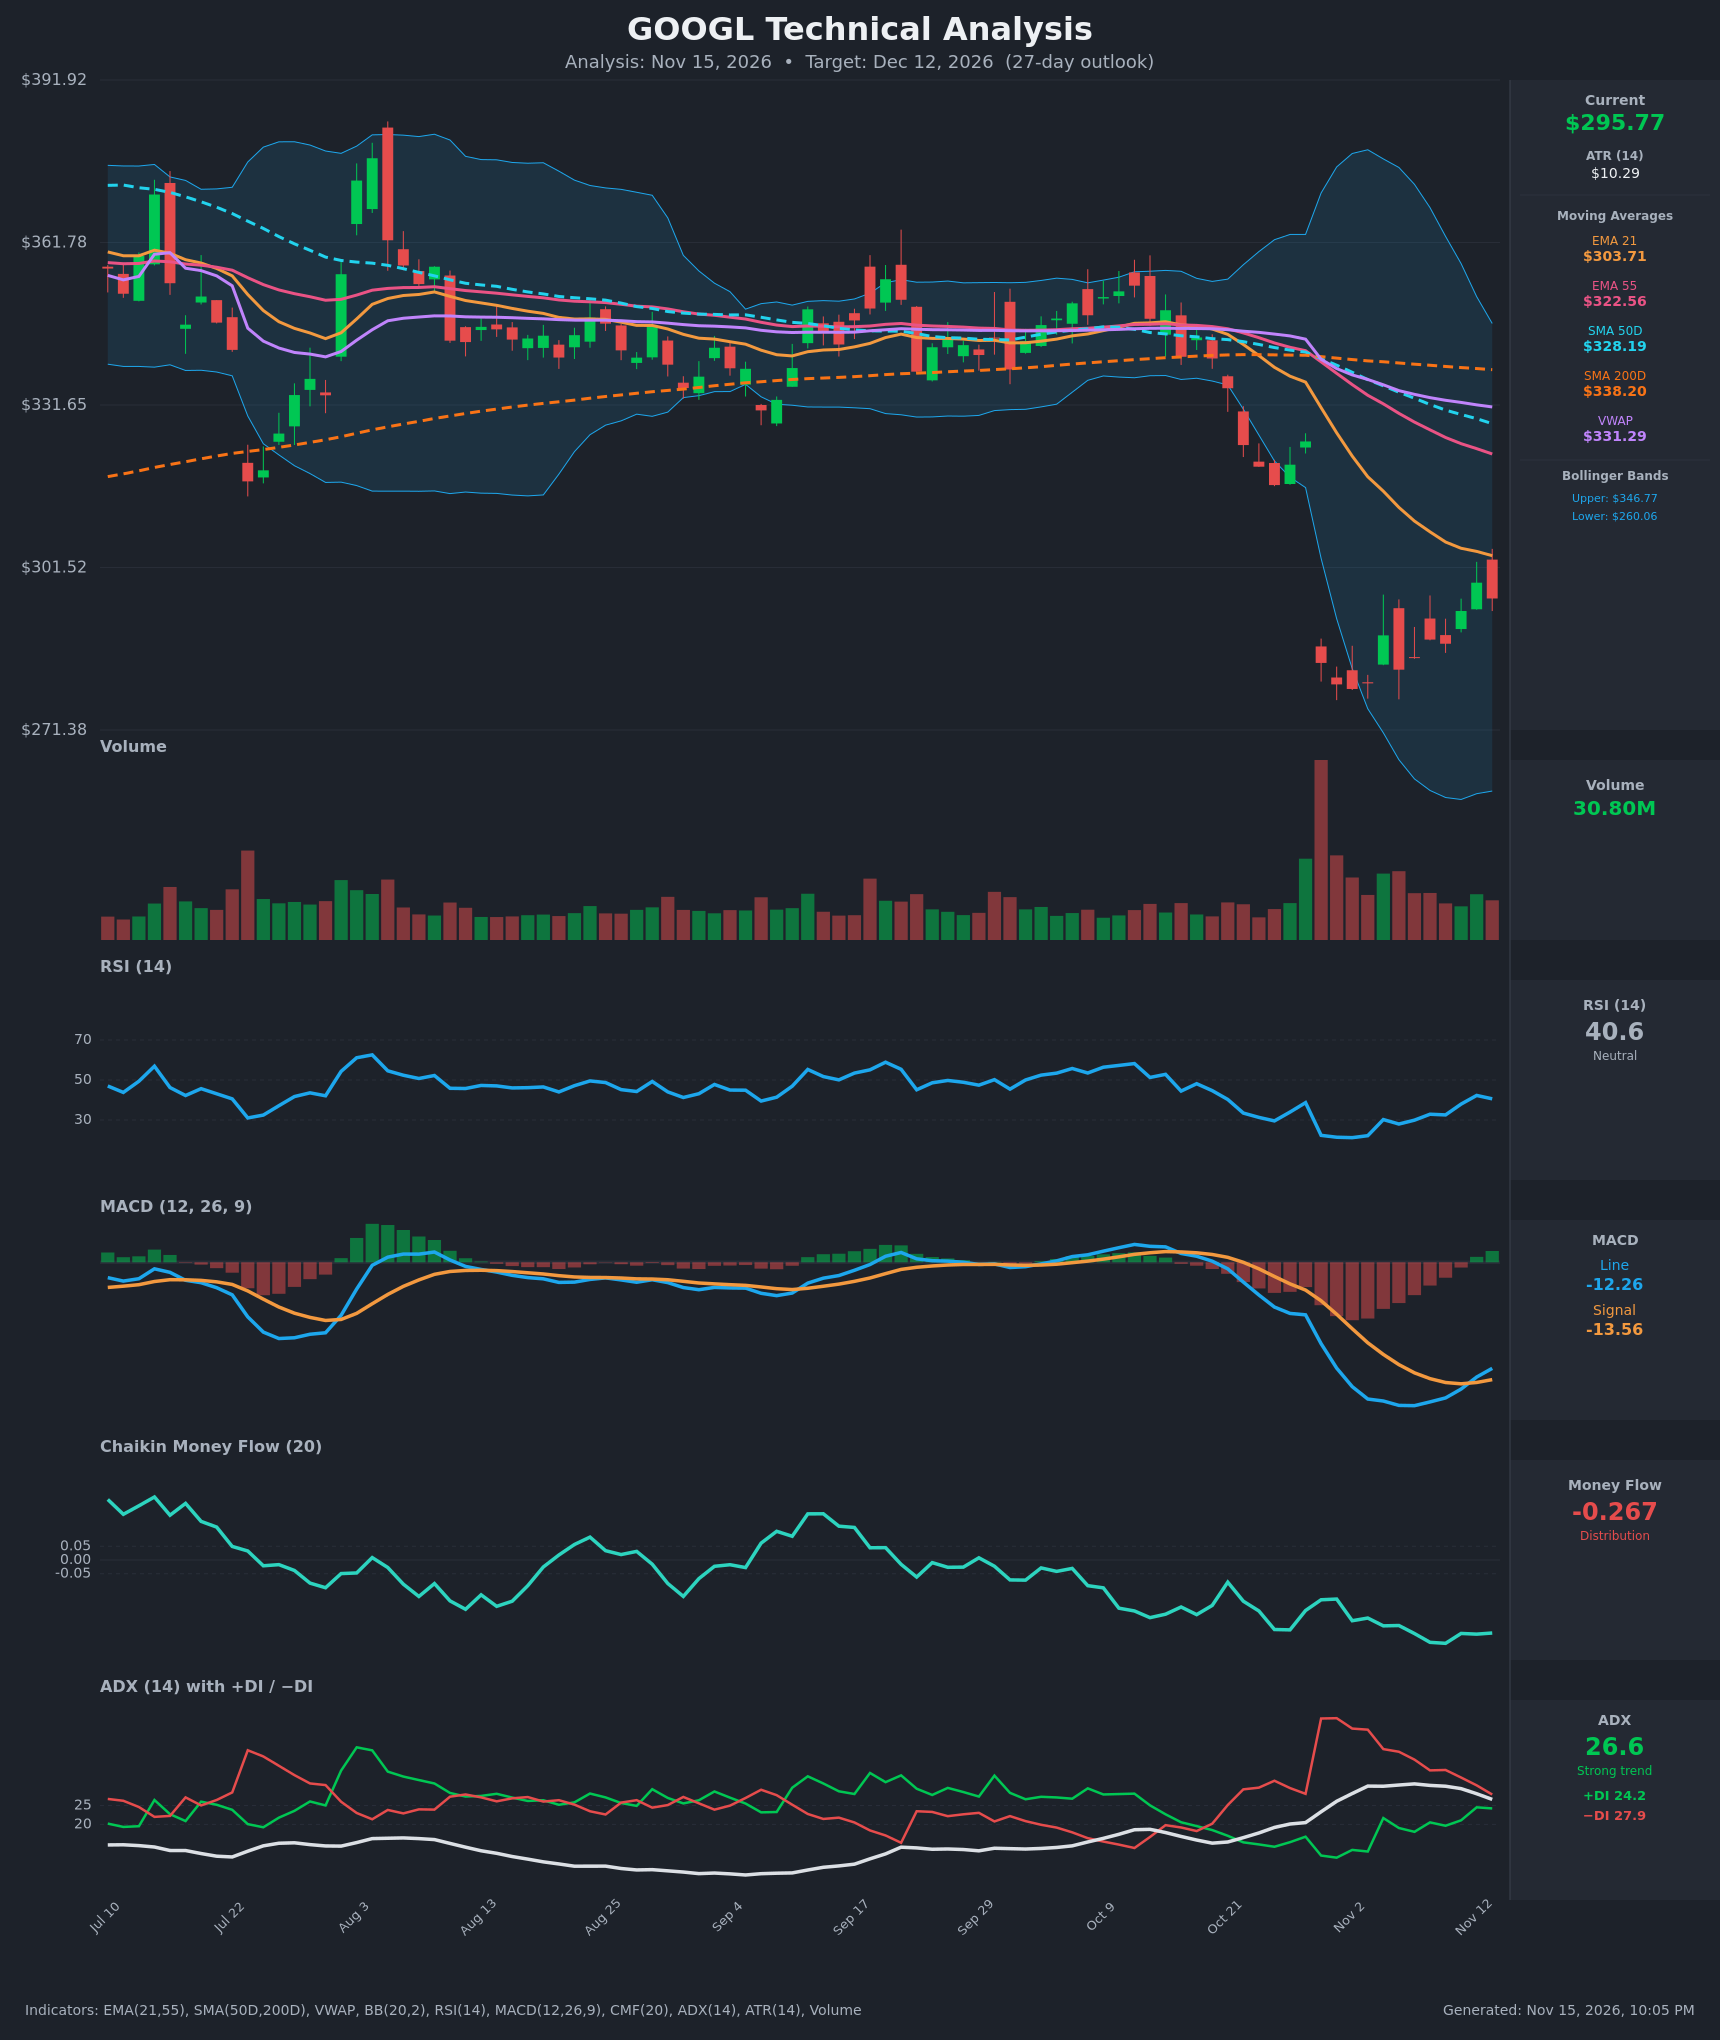
- RSI (14): 40.58, rebounding from a deeply oversold 21.2 (Nov 2) but turned down from 42.3 on the last bar. It is still below 50, so the bounce hasn't shifted momentum to bulls. [Neutral]
- 20 EMA: The data gives EMA 21 at $303.71. Price at $295.77 is below it, and the last two bounce attempts stalled just under it. EMA 21 is also below EMA 55 ($322.56) and still sloping down, so it acts as resistance. [Bearish]
- MACD: Line -12.26 is above signal -13.56, a bullish crossover on Nov 12, and the histogram has turned positive. This is a crossover deep below zero, so it is more a relief signal than a trend reversal. [Bullish]
- Bollinger Bands (20): Upper $346.77, lower $260.06, midline about $303.4. Price sits in the lower half, below the midline, after tagging the lower band area during the capitulation. The bands are very wide after the gap, so volatility is elevated. The midline roughly coincides with EMA 21 as overhead resistance. [Bearish]
- CMF (20): -0.267, well below -0.05 and near the lows of the whole chart. It kept falling while price bounced from $279 to $298, so the bounce lacks buying support. [Distribution]
- ADX (14): 26.6 and slipping from 30.7, with -DI (27.9) above +DI (24.2). The trend is still down, but the gap has narrowed from about 30 points to under 4, so selling pressure is fading and a DI cross is possible. [Strong Trend, bearish but weakening]
- Volume: 30.80M, well below the Oct 29 gap-down spike and roughly in line with the recent average. The bounce candles came on only moderate volume, with no sign of aggressive accumulation. [Neutral to mildly bearish]
DIVERGENCES & TRENDS
- Bearish divergence (CMF): Price rose from $279 to $298.70 while CMF fell from -0.14 to -0.27, so money flow is not confirming the rebound.
- Bullish divergence (MACD, RSI): The MACD line has risen from -16.57 to -12.26 and crossed the signal line. RSI has recovered from 21 to the low 40s. These are the early signs of a relief bounce.
- Death cross: SMA50 ($328.19) crossed below SMA200 ($338.20) around Oct 29, a major long-term bearish signal. Price is below SMA50, SMA200, both EMAs and VWAP ($331.29).
- EMA structure: EMA21 is below EMA55, so short-term trend remains down.
- ADX/DI: −DI is still on top, but the spread is narrowing.
- Gap: The Oct 29 gap from about $325 to $284 remains largely unfilled and acts as overhead supply.
CHART PATTERNS
- Bearish flag / rising channel (bearish continuation): After the sharp gap-down "flagpole", price has formed higher lows and higher highs in a small rising channel of $279–$299. A break below the channel base (about $285–$288) projects a measured move toward $255–$265, and the flagpole height of roughly $40 makes that a plausible downside target.
- Possible double bottom (bullish reversal): The lows at $279–$280 (Oct 30 and Nov 3) are a loose double bottom, with the neckline near $299–$304. A close above $304 would be needed to activate it, which would target about $320–$325 and a fill of the gap. This is a lower-probability read because CMF and the moving averages don't support it.
- Bearish read: The flag is the stronger read, as it aligns with the death cross, distribution and the EMA structure.
POTENTIAL SCENARIOS
- Scenario 1: Bearish Flag Breakdown — The bounce fades at EMA21/Bollinger midline (~$303–$305). Price rolls over and retests the $279 lows, with the downtrend continuing as CMF stays negative. Trigger: rejection at $303–$305, then a close below $288 and especially below $279. Target: $270–$280, with an extension to $260 (lower Bollinger Band). Invalidation: daily close above $306 on rising volume. (45% probability)
- Scenario 2: Bullish Relief Rally / Gap Fill Attempt — The MACD cross and a rising RSI power a squeeze through EMA21, and DIs cross bullishly. Trigger: close above $304–$305 with a volume pickup. Target: $315–$322 (EMA55 and part of the gap). Invalidation: close back below $288. (35% probability)
- Scenario 3: Neutral Range Consolidation — Price chops between $279 and $304 as the oversold condition resolves through time rather than price. Trigger: repeated failures at both $304 and $280 as ADX falls below 20. Target: $285–$300. Invalidation: a close beyond either boundary. (20% probability)
PRICE TARGETS
For the 27-day horizon (to about Dec 12, 2026), the bias is modestly bearish. The expected move is about 0.7 ATR-adjusted standard deviations lower, given that rallies are capped by overhead resistance.
- Target Price: $288.00
- Expected Range: $268.00 to $314.00 (width $46, about 15.6% of current price, consistent with the 12–18% guidance for 30–60 day windows, scaled down slightly for 27 days)
- Key Levels: Support at $279.00, Resistance at $304.00
OVERALL BIAS
OVERALL BIAS: BEARISH - Price sits below all major moving averages after a death cross, CMF shows heavy distribution that diverges from the bounce, and the rising channel after the gap looks like a bearish flag capped at EMA21 (~$304). The MACD crossover and fading ADX argue for a relief bounce first, but the weight of evidence favors a retest of the $279 lows.
This is educational analysis and not financial advice.