GOOGL 34-day bullish forecast — Nov 15, 2026
- Bias: Bullish
- Timeframe: 34 days (made Nov 15, 2026, target date Dec 18, 2026)
- Price at analysis: $295.77
- Price target: $306.00
- Expected range: $280.00 – $326.00
- Result: Pending — graded after the close on Dec 18, 2026
Get a free AI analysis of GOOGL today
Analysis
TECHNICAL INDICATORS
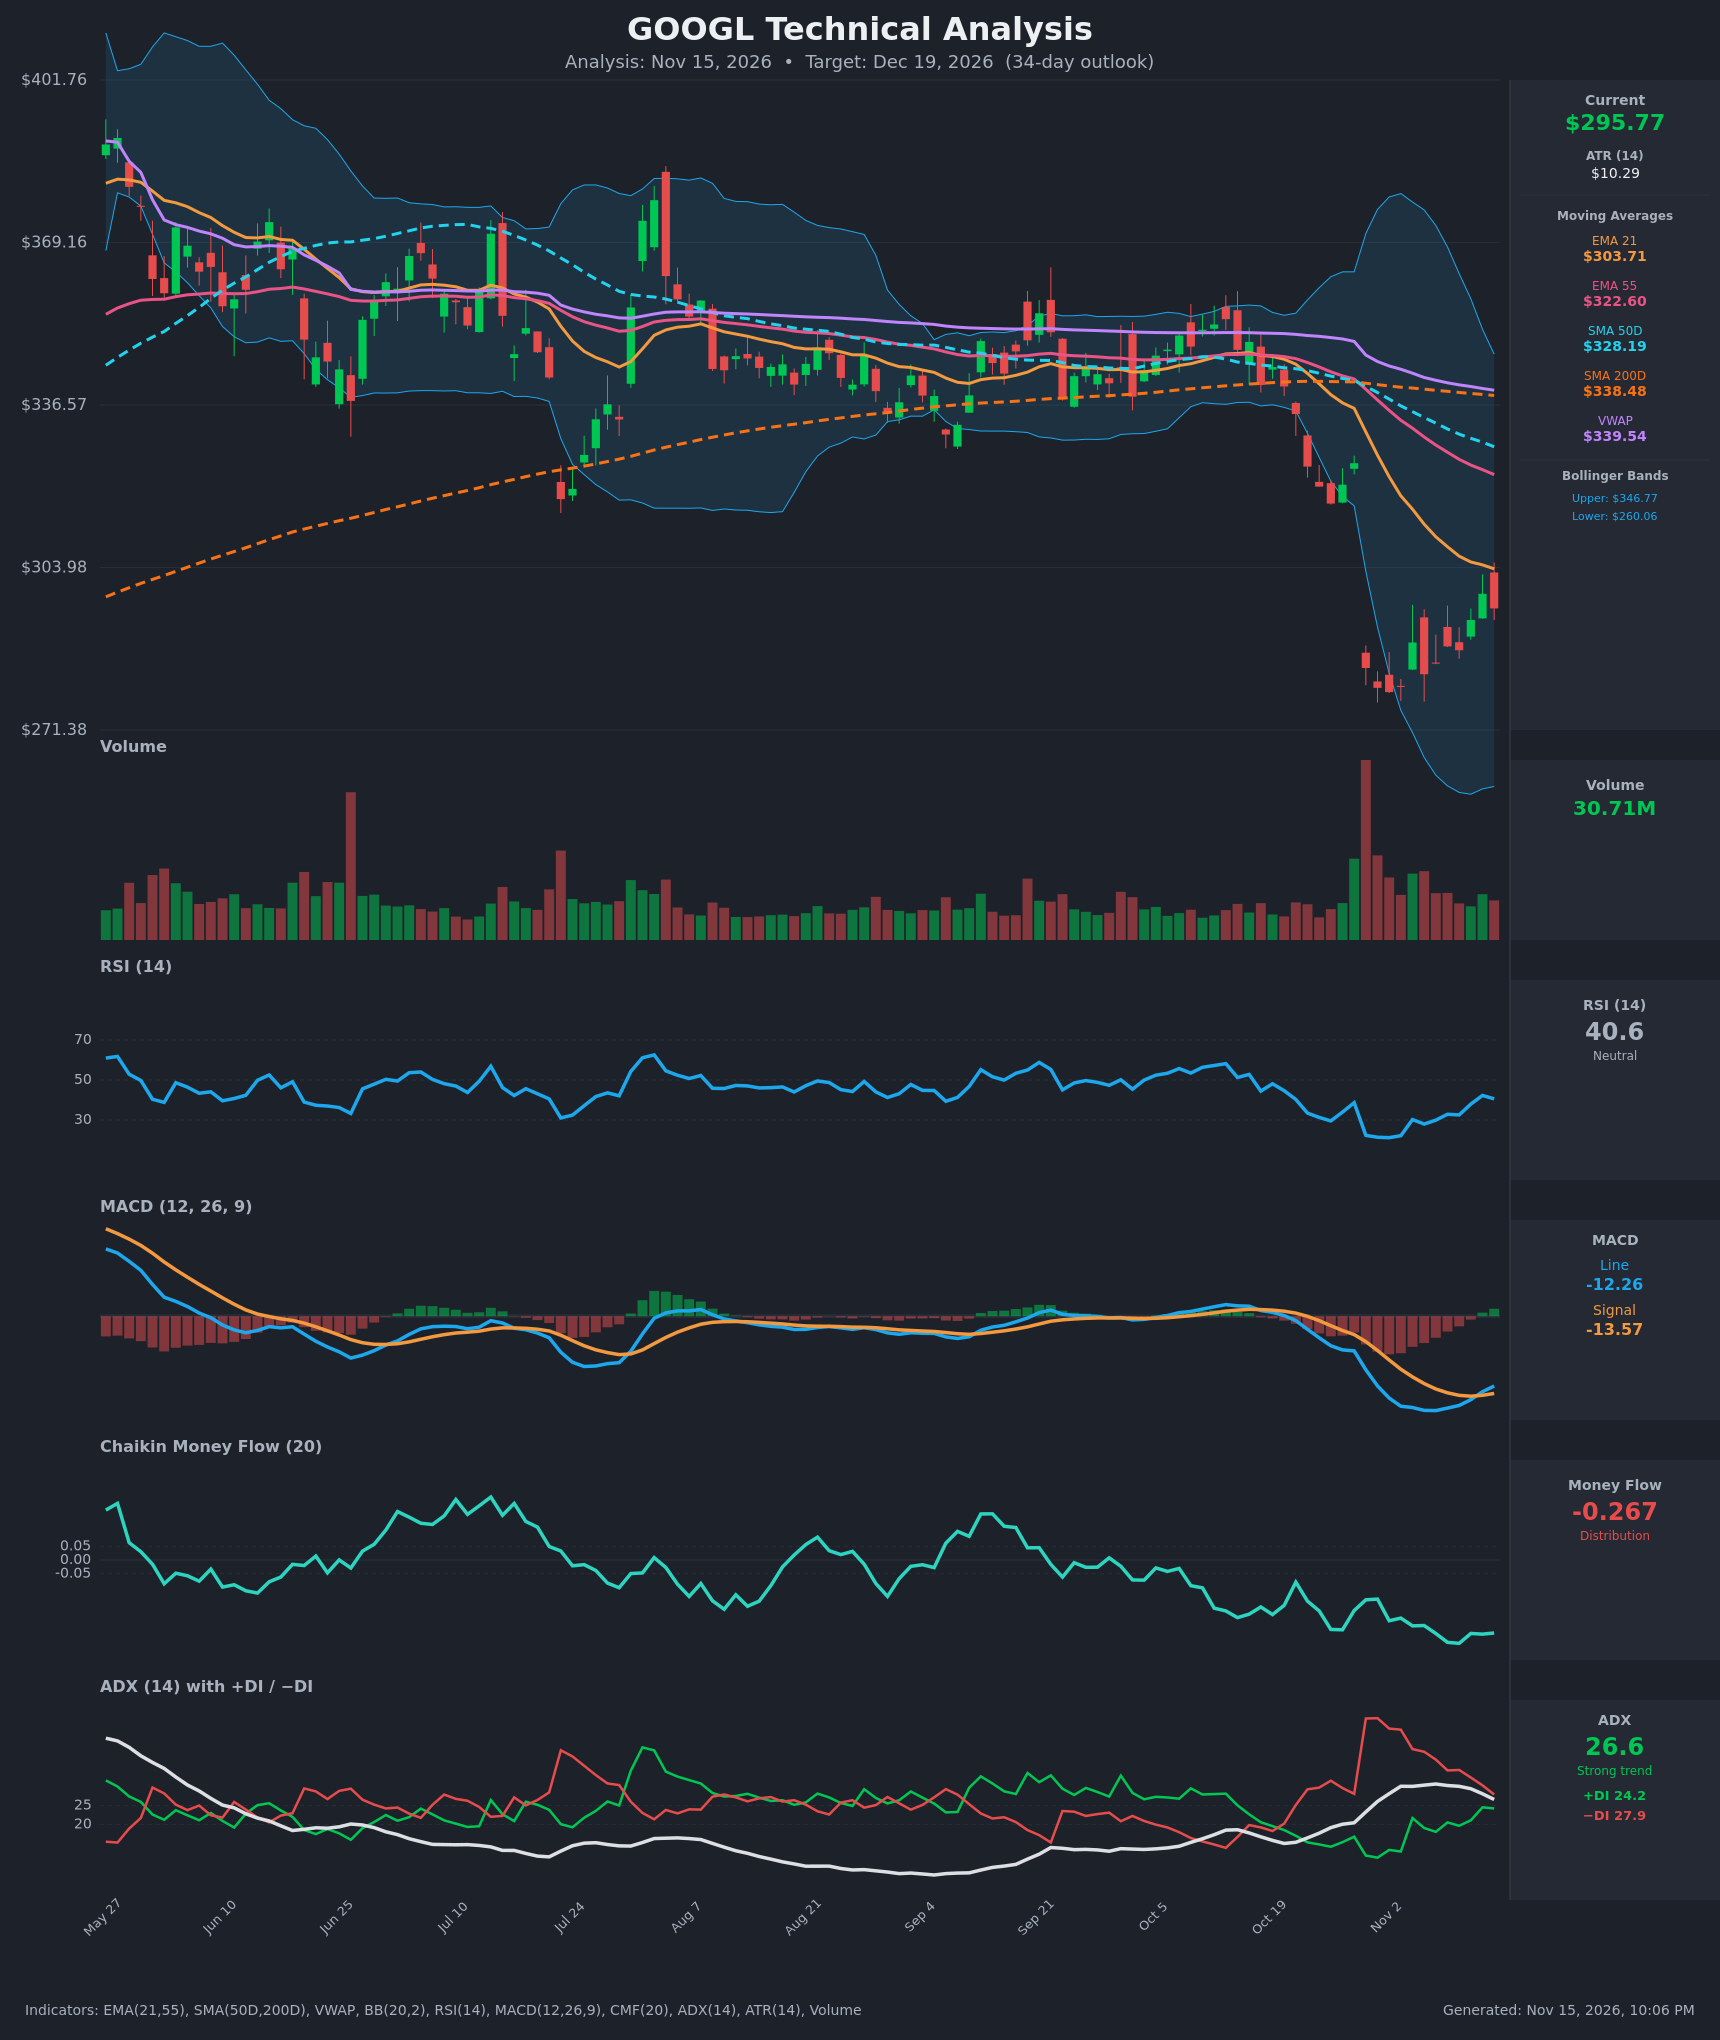
- RSI (14): 40.58, recovering from an extreme oversold low of 21.2 on Nov 2 and 22.2 on Nov 3. It is rising but still below 50, which separates a relief bounce from a trend reversal. The last bar ticked down from 42.3. [Neutral]
- 20 EMA (EMA 21): $303.71, falling steadily. Price at $295.77 is below it, and the Nov 12 close of $298.70 failed to reach it. It is overhead resistance, and EMA 55 ($322.60) sits well above. [Bearish]
- MACD: Line -12.26 is above Signal -13.57, a fresh bullish crossover on Nov 13 (it was still below on Nov 12). The histogram has turned slightly positive. Both lines are deeply negative, so this is early momentum repair inside a downtrend. [Bullish]
- Bollinger Bands (20): Upper $346.77, lower $260.06, midline about $303.4. The bands are very wide after the Oct 29 gap-down. Price has moved from the lower band back toward the midline and is in the lower half of the bands. The midline lines up with EMA 21 as resistance. [Neutral]
- CMF (20): -0.267, well below -0.05 and near the lowest of the visible period. It has not turned up with price, so rebound buying lacks conviction. [Distribution]
- ADX (14): 26.6 with −DI 27.9 above +DI 24.2. ADX is above 25, so the trend is still strong and bearish. It is slipping from its 30.7 peak, and the DI spread has narrowed from about 31 points on Oct 29-30 to 3.7. Bears are still marginally in control but fading. [Strong Trend – Bearish, weakening]
- Volume: 30.71M, with a huge spike near the Oct 29 gap-down (heavy-volume capitulation). Volume has been moderate on the bounce, with mixed green and red bars and no strong accumulation surge. [Neutral – no confirmed accumulation]
Longer-term structure:
- Price is below SMA 50 ($328.19), SMA 200 ($338.48) and VWAP ($339.54).
- EMA 21 is below EMA 55.
- A death cross occurred on Oct 29, when SMA 50 slipped below SMA 200.
- All of this points to a long-term downtrend.
DIVERGENCES & TRENDS
- Bullish momentum divergence (modest): Price made a lower low or equal low (about $279-$283 on Nov 2-5) while MACD and RSI rose from their lows. RSI went from 21.2 to 40.6, and MACD crossed up on Nov 13.
- Bearish non-confirmation: CMF fell from -0.14 to -0.27 during the bounce and has not confirmed it. Money flow is diverging negatively from the price rebound.
- Crossovers and breaks:
- Death cross on Oct 29.
- MACD bullish cross on Nov 13.
- −DI still above +DI, but the gap is narrowing (a bullish DI cross is possible within days).
- Price remains below EMA 21 and has been rejected near the $298-$299 area.
- Trend: Price has put in higher lows ($278.99 → $282.57 → $284.78) after the gap-down, but the broader trend is down.
CHART PATTERNS
- Possible Bullish Double Bottom (small scale): Lows around $279-$283 (Oct 30-Nov 5) with a neckline near $298.70 (the Nov 12 high). A close above that neckline projects a measured move of roughly $20, to about $318-$320. This also coincides with the gap-fill zone near $325.
- Bearish Flag / Descending structure (competing read): After the sharp Oct 29 gap-down, the sideways-to-up drift of Nov 4-13 could be a bearish flag. A break below $279 would project toward $255-$260 (the lower Bollinger Band).
- Neither pattern is confirmed. The key line is the $298.70 neckline versus the $279 low.
POTENTIAL SCENARIOS
- Scenario 1: Bullish Relief Rally Through the EMA 21 — The MACD cross, rising RSI and narrowing DI spread support continued mean reversion from the oversold gap-down. Trigger: daily close above $303.71 (EMA 21), and above the $298.70 neckline first. Target: $318-$325 (EMA 55 / gap-fill area), with a base case of about $306 at the 34-day mark. Invalidation: close below $279. (45% probability)
- Scenario 2: Bearish Downtrend Resumption — Price rejects at EMA 21 and the $298-$304 area, CMF stays deeply negative and −DI regains dominance, as the death cross and the below-all-averages structure suggest. Trigger: rejection at about $303 and a close below $284. Target: $262-$270 (lower Bollinger Band area). Invalidation: close above $304 with CMF turning positive. (40% probability)
- Scenario 3: Neutral Range Chop — Price oscillates between the $279 low and the $304 EMA 21 as the ADX trend strength fades. Trigger: ADX falling below 20 with +DI and −DI converging. Target: $285-$300. Invalidation: a decisive close outside $279-$304. (15% probability)
PRICE TARGETS
Range width check: $326.00 − $280.00 = $46.00, or about 15.6% of $295.77, which fits the 30-60 day guidance of 12-18%. (ATR of $10.29 is about 3.5% per day, so a 34-day horizon supports a wide range.)
- Target Price: $306.00 (34-day)
- Expected Range: $280.00 to $326.00
- Key Levels: Support at $279.84 (the early-November swing low), Resistance at $303.71 (EMA 21). Beyond that, EMA 55 at $322.60 and SMA 50 at $328.19 are the next resistance.
OVERALL BIAS
OVERALL BIAS: BULLISH - Oversold relief is underway, with RSI recovering from 21, a fresh bullish MACD crossover, higher post-gap lows and a narrowing DI spread, which favor a move back toward the EMA 21/EMA 55 zone. Conviction is modest. CMF distribution, the death cross and price below every major average mean a close below $279 would flip the view.
This is educational analysis and not financial advice.