GOOGL 20-day bullish forecast — Nov 15, 2026
- Bias: Bullish
- Timeframe: 20 days (made Nov 15, 2026, target date Dec 4, 2026)
- Price at analysis: $295.77
- Price target: $303.50
- Expected range: $288.00 – $319.00
- Result: Pending — graded after the close on Dec 4, 2026
Get a free AI analysis of GOOGL today
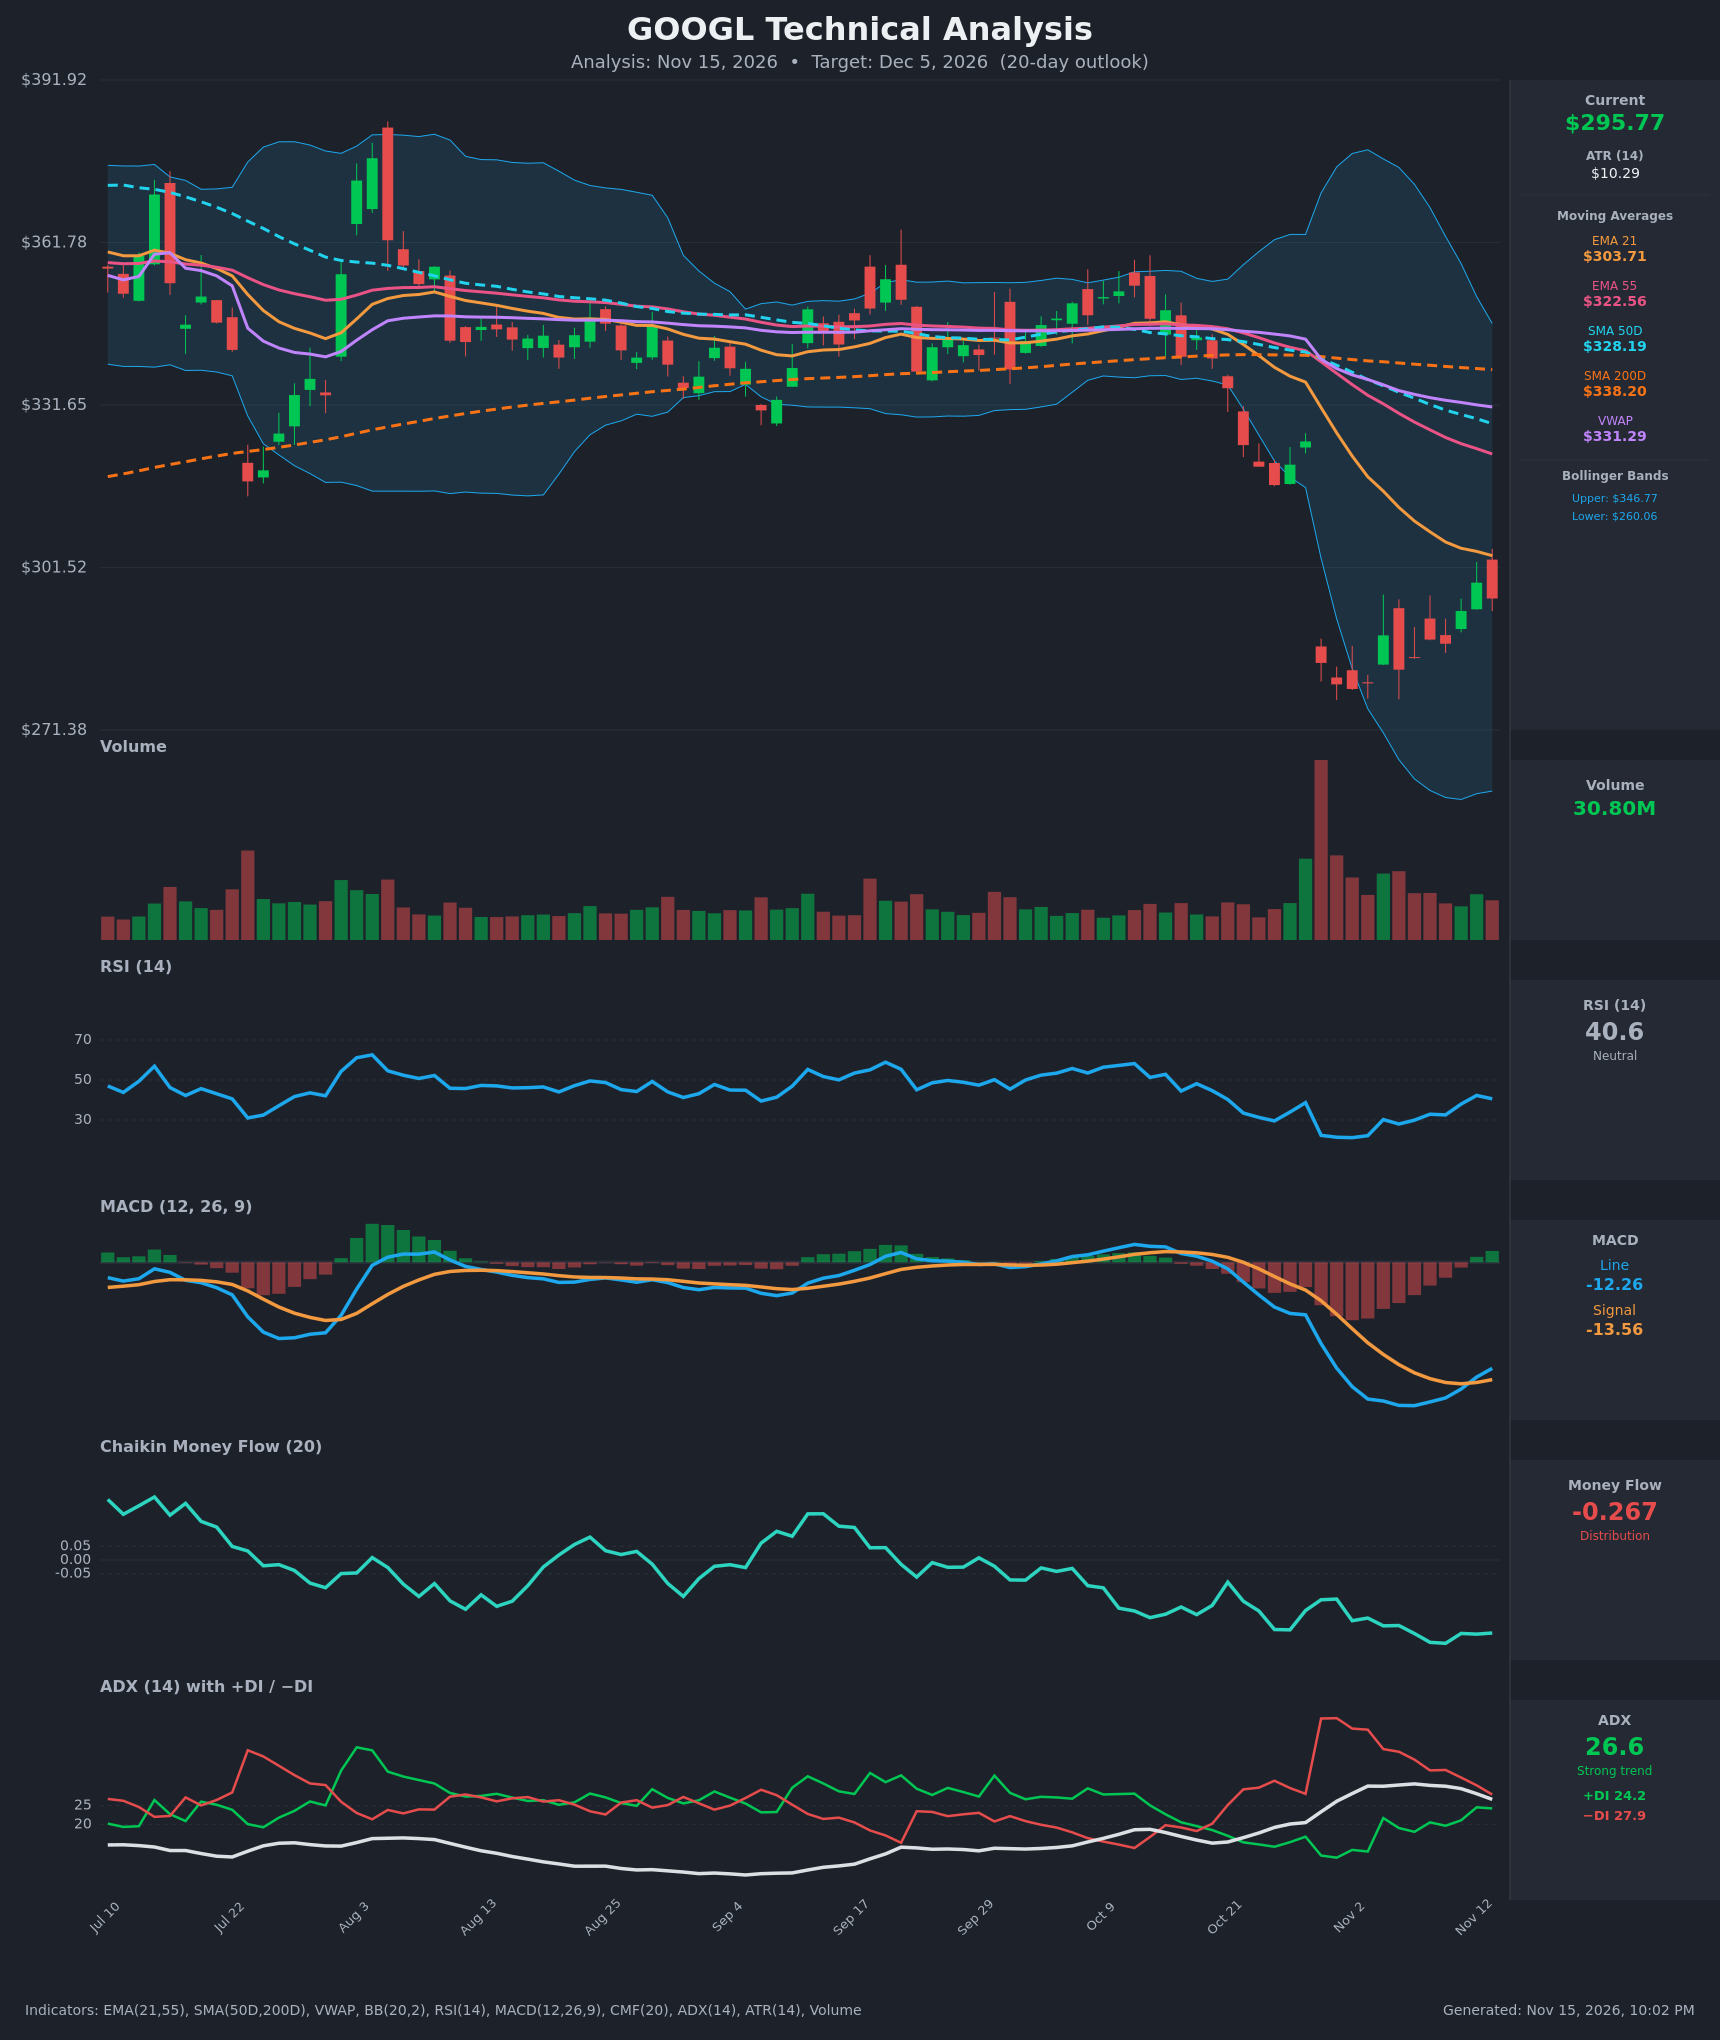
Analysis
TECHNICAL INDICATORS
- RSI (14): 40.58, up from the 21 oversold low on Oct 30 and a 42.3 peak on Nov 12. Momentum is recovering but still below 50. [Neutral]
- 20 EMA: The EMA 21 is $303.71 and falling. Price at $295.77 is below it, so it acts as overhead resistance, with the EMA 55 ($322.56) above that. [Bearish]
- MACD: The line (-12.26) crossed above the signal (-13.56) on Nov 12. The histogram has turned slightly positive, but both lines are deeply negative, so this is a bounce signal rather than a trend reversal. [Bullish]
- Bollinger Bands (20): Upper $346.77, lower $260.06, midline about $303. The bands are wide after the Oct 29 gap-down. Price has bounced off the lower half and sits below the midline, which lines up with the EMA 21 as the first resistance. [Neutral]
- CMF (20): -0.267, deeply negative and still near its lows. This is persistent distribution, with no sign of accumulation behind the bounce. [Distribution]
- ADX (14): 26.6 and falling from 30.7, with −DI (27.9) still above +DI (24.2). The bearish trend is losing strength and the DI spread is narrowing, so a bullish DI crossover is possible. [Strong but weakening trend, bearish]
- Volume: 30.80M, well below the capitulation spike on Oct 29. The bounce is happening on moderate, fading volume, so buyers are not showing strong conviction. [Neutral to mildly bearish]
DIVERGENCES & TRENDS
- Moving averages: Price is below the EMA 21, EMA 55, SMA 50 ($328.19), SMA 200 ($338.20) and VWAP ($331.29). That is a clear long-term downtrend structure. The SMA 50 is below the SMA 200 (a death-cross structure), so the larger trend remains bearish.
- Bullish momentum divergence: Price made a lower low around $279 on Oct 30 – Nov 2. RSI and the MACD histogram have since improved steadily, and price has formed higher lows ($279, $283, $287). The MACD crossover and RSI recovery support a relief bounce.
- Bearish money flow: CMF has not confirmed the bounce, because money flow is still near its lows.
- DI convergence: +DI has risen from 11 to 24 while −DI has fallen from 48 to 28. A +DI/−DI crossover is a key watch item.
- Latest bar: Nov 13 closed down 1% after a rejection near $299, so short-term momentum has stalled.
CHART PATTERNS
- Post-capitulation base (Bullish Falling Wedge / Double Bottom-like): After the gap-down, price has made higher lows from $279 to $283 to $287. Compared with the reference diagram, this resembles an early double-bottom or falling-wedge reversal. It has not been confirmed, because price has not broken above the $299–$304 resistance zone.
- Bearish flag risk: The bounce on declining volume under a falling EMA 21 could also be a bearish flag or pennant continuation. A break below $283 would target roughly $270 or lower, measured from the Oct 29 drop.
- Gap: The unfilled gap between $284 and $325 is a magnet for price. In practice it is likely to cap rallies near the EMA 21 and EMA 55.
POTENTIAL SCENARIOS
- Scenario 1: Bullish Relief Rally to the EMA 21 — The MACD crossover, rising RSI and DI convergence extend the bounce into the falling EMA 21 and Bollinger midline. Trigger: close above $299–$300, then a push through $303.71. Target: $303–$312, with an extension to $319 if the EMA 21 breaks on volume. Invalidation: close below $283. (45% probability)
- Scenario 2: Bearish Rejection and Retest of Lows — The bounce fails at the EMA 21 resistance, with CMF distribution and −DI dominance dragging price back to the lows. Trigger: rejection at $300–$304 or a break below $287. Target: $279, then $270–$272. Invalidation: daily close above $304 on rising volume. (35% probability)
- Scenario 3: Neutral Consolidation — Price chops between $283 and $304 as ADX fades and the bounce stalls. Trigger: failure to break either side. Target: $290–$300. Invalidation: close outside the $279–$304 range. (20% probability)
PRICE TARGETS
- Target Price: $303.50 (20-day, a retest of the EMA 21 and Bollinger midline)
- Expected Range: $288.00 to $319.00 (width $31.00, about 10.5% of the current price, in line with the 14–21 day guidance)
- Key Levels: Support at $279.00, Resistance at $303.71
OVERALL BIAS
OVERALL BIAS: BULLISH - The MACD bullish crossover, rising RSI from oversold, higher lows after capitulation and narrowing DI spread favor a relief rally toward the EMA 21 (about $303–$304). Conviction is modest because price is below all major moving averages, CMF shows heavy distribution, and −DI is still on top.
This is educational analysis and not financial advice.