GOOGL 83-day bearish forecast — Nov 15, 2026
- Bias: Bearish
- Timeframe: 83 days (made Nov 15, 2026, target date Feb 5, 2027)
- Price at analysis: $295.77
- Price target: $281.00
- Expected range: $258.00 – $318.00
- Result: Pending — graded after the close on Feb 5, 2027
Get a free AI analysis of GOOGL today
Analysis
TECHNICAL INDICATORS
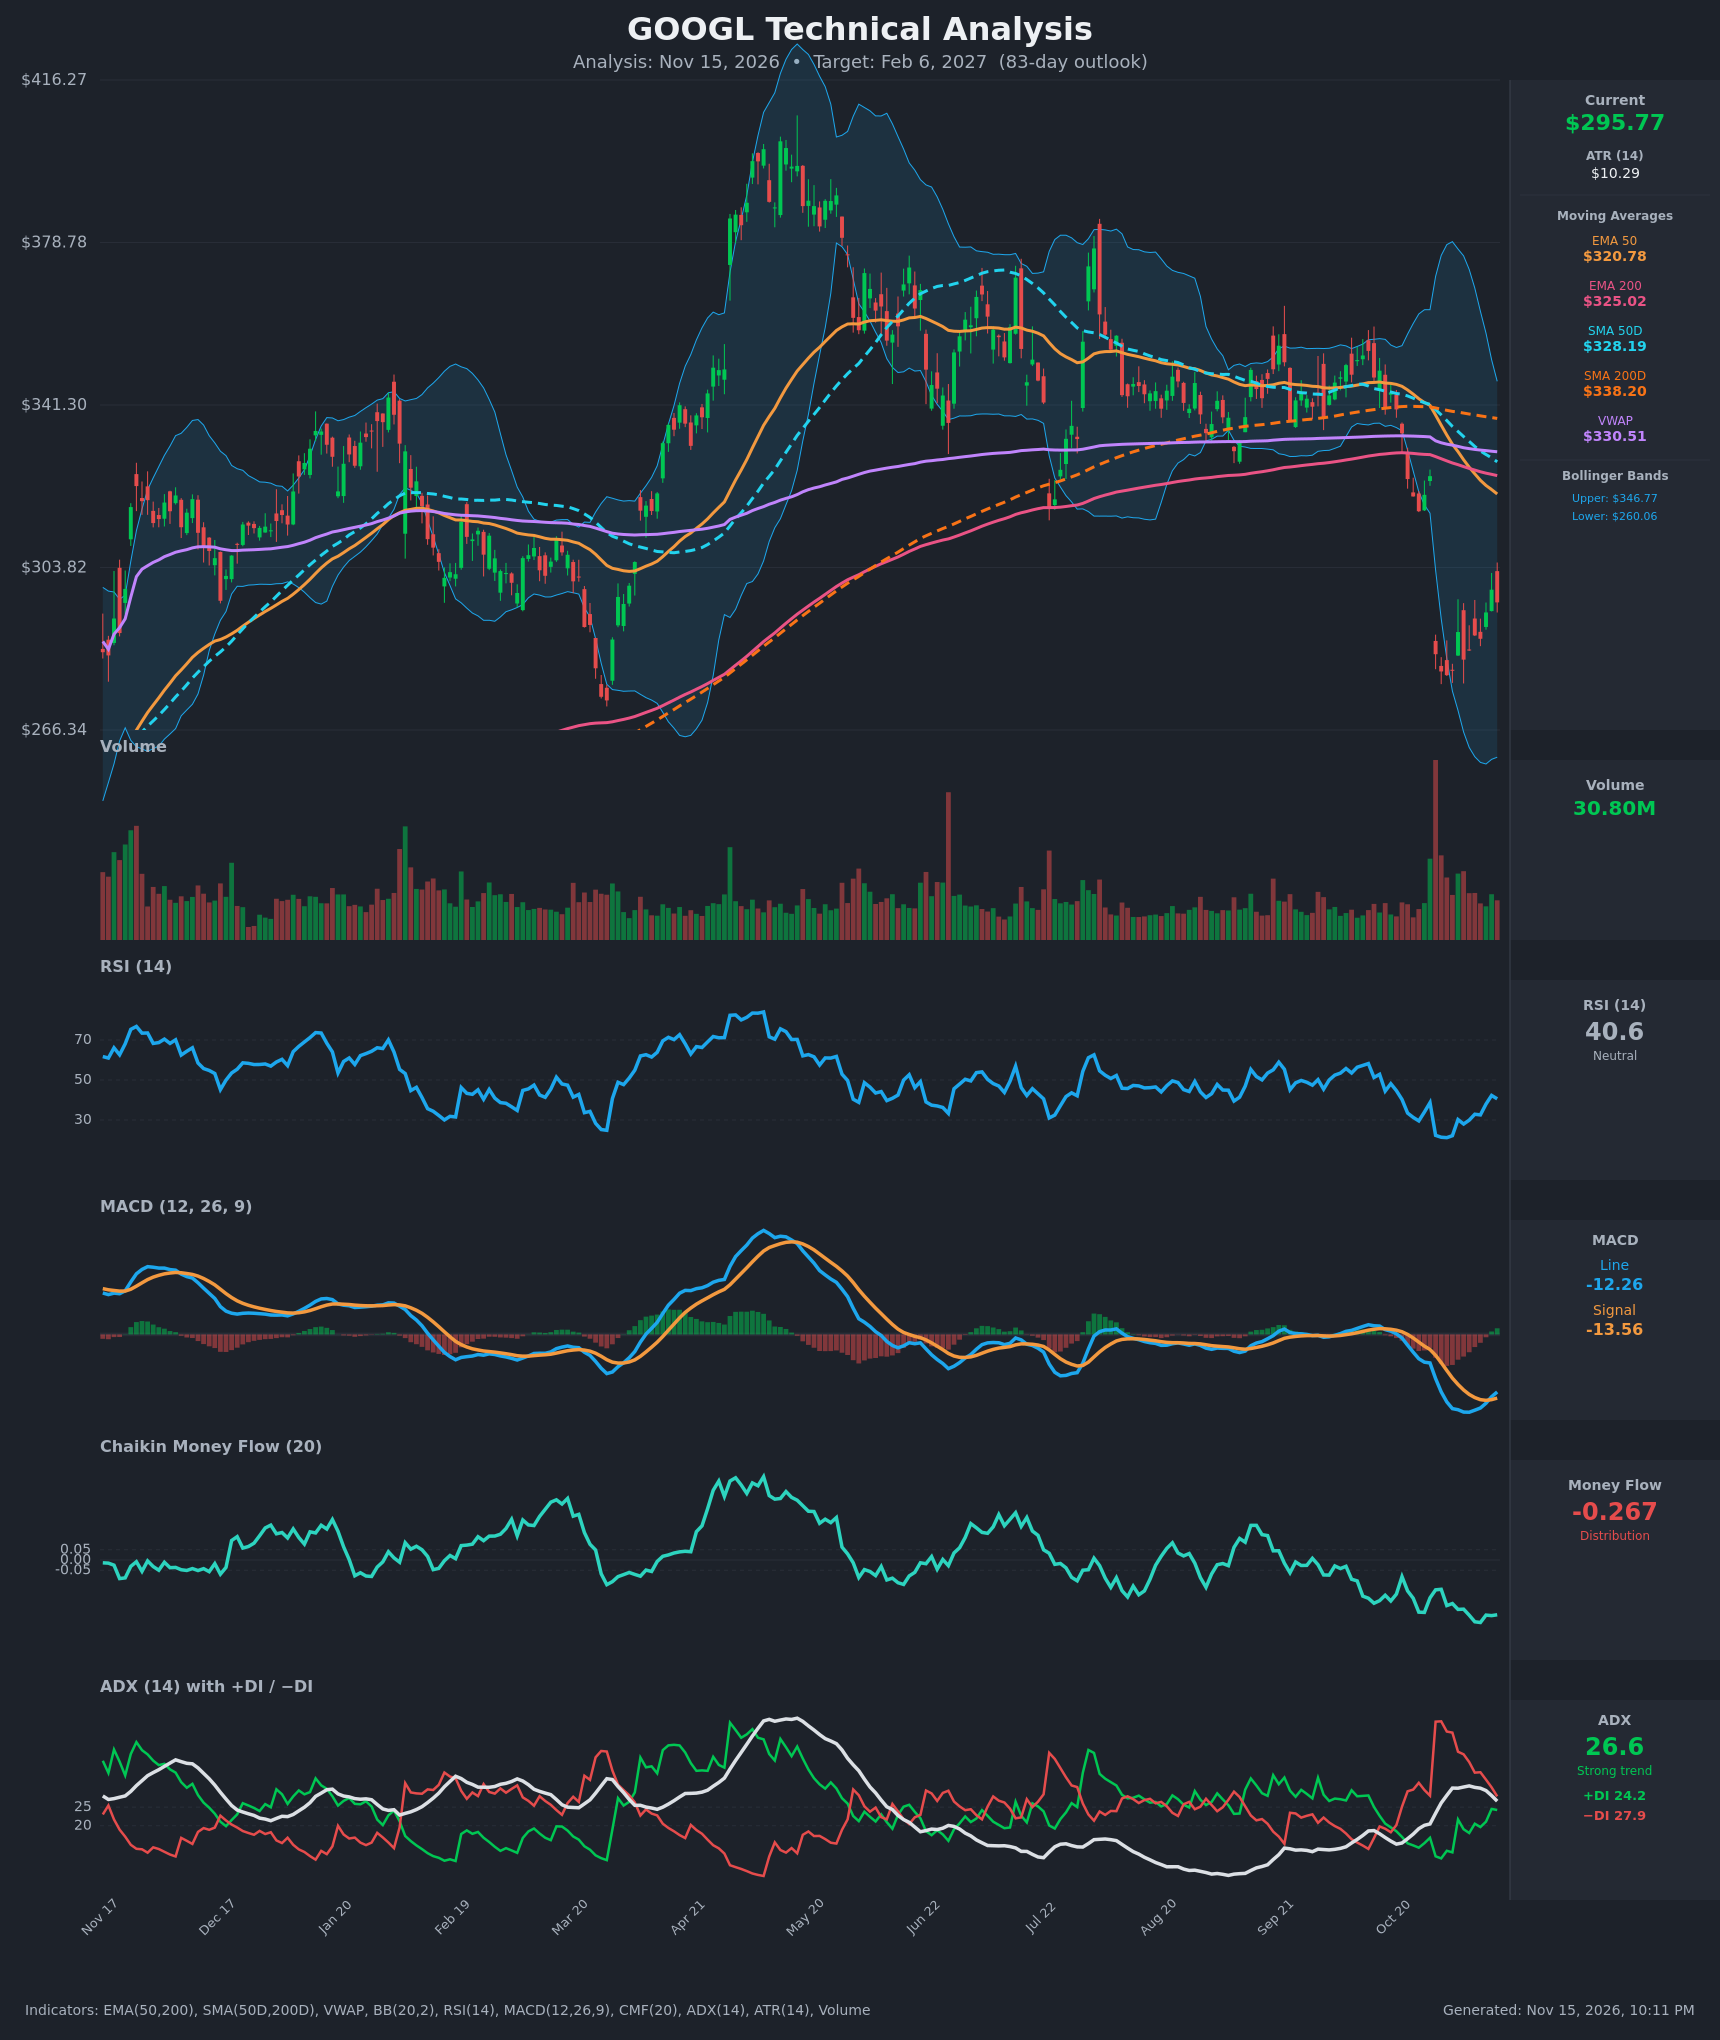
- RSI (14): 40.58, up from a 21.2 oversold low on Nov 2 and a 42.3 peak on Nov 12. Momentum is recovering, but RSI has failed to reach 50 and turned down slightly on the last bar. [Neutral]
- 20 EMA: The 20 EMA isn't supplied. The Bollinger midline (20-period average) is about $303.4, and price at $295.77 sits below it, so it acts as resistance. Price is also below EMA50 ($320.78), EMA200 ($325.02) and VWAP ($330.51). [Bearish]
- MACD: Line -12.26 is above signal -13.56, so there was a bullish crossover around Nov 11-12 and the histogram is turning positive. Both lines are deeply below zero, so this is a bounce within a downtrend, not a trend reversal. [Neutral]
- Bollinger Bands (20): Upper $346.77, lower $260.06. Price touched the lower band zone after the Oct 29 gap and has bounced into the lower half of the bands. It is still below the midline, and the wide bands reflect elevated volatility after the selloff. [Bearish]
- CMF (20): -0.267, far below -0.05 and near the lowest on the chart. It has been negative for weeks and is not improving despite the price bounce. [Distribution]
- ADX (14): 26.6 and slipping from 30.7. −DI (27.9) is above +DI (24.2), but the gap has narrowed from about 31 points (Oct 29-30) to 3.7. The trend is still down but losing steam. [Strong Trend + Bearish, fading]
- Volume: 30.80M on the latest bar, normal compared with the huge spike on the Oct 29 gap-down. The bounce has come on average volume, so there is no clear buyer capitulation or conviction. [Neutral to mildly Bearish]
DIVERGENCES & TRENDS
- Bullish divergence (short term): price made a similar low on Nov 5 (about $282.57) versus Oct 30-Nov 2 (about $279-280), while RSI rose from 21 to 28 and MACD is crossing up. This points to fading downside momentum.
- Bearish divergence (money flow): CMF keeps falling (-0.14 to -0.30) while price bounced, so the rally lacks accumulation.
- Moving averages: the SMA50D ($328.19) has been below the SMA200D ($338.20) since early November, a death cross. EMA50 crossed below EMA200 around Nov 10 and the gap is widening. All major averages are sloping down.
- Price vs. SMA200D: price is about 12.5% below it, a long-term downtrend.
- ADX/DI: −DI remains on top. +DI is rising and ADX is falling, so a bottoming or consolidation phase is plausible, but no bullish DI crossover has occurred.
- Gap: the Oct 29 gap-down (about $324.89 to $283.82) is unfilled and likely acts as overhead supply in the $300-$325 zone.
CHART PATTERNS
- Broad Bearish Head and Shoulders (loose): the April peak near $416 is the head, with lower highs near $380 in July and about $370 in September. The neckline area near $285-$300 was broken by the October gap-down. The full measured move is far beyond this horizon, so I treat it as a bearish structural backdrop rather than a target.
- Minor Bullish Double Bottom (unconfirmed): lows near $279-$283 with a neckline around $298.70. Price rejected the neckline on Nov 12-13, so it is not confirmed. A close above $299-$300 on volume would target about $315-$318 (the pattern height of about $19 added to the neckline).
- Bearish Flag/Pennant tendency: the small rebound after the sharp drop is consistent with a bearish continuation flag, which projects a retest of the $279 lows and possibly lower.
POTENTIAL SCENARIOS
- Scenario 1: Bearish Lower-High Rollover and Retest of Lows — the bounce stalls under the $303 midline and the $320 EMA50 cluster, CMF stays in distribution, and price rolls over to retest the $279 lows. Trigger: rejection at $299-$305 followed by a close below $288. Target: $278-$282 first, with an extension to $262-$265 (lower Bollinger band area) if $279 breaks. Invalidation: a daily close above $321 (EMA50). (50% probability)
- Scenario 2: Bullish Relief Rally and Gap Fill — the double bottom confirms, MACD and RSI continue higher, and price climbs toward the moving average cluster. Trigger: a close above $299-$300 on rising volume with CMF turning toward zero. Target: $315-$325 (EMA50/EMA200 and gap area). Invalidation: a close below $279. (33% probability)
- Scenario 3: Neutral Range Consolidation — price chops between about $280 and $305 as ADX fades below 20. Trigger: failed breaks of both $279 and $305. Target: about $290-$298. Invalidation: a close outside $275-$310. (17% probability)
PRICE TARGETS
- Target Price: $281.00 (83-day horizon)
- Expected Range: $258.00 to $318.00 (width $60 = about 20.3% of current price, consistent with the 18-30% guidance for 61-180 days)
- Key Levels: Support at $278.99, Resistance at $320.78
OVERALL BIAS
OVERALL BIAS: BEARISH - Price is below every major moving average after a death cross, CMF shows heavy distribution (-0.267), and −DI is still above +DI with ADX above 25. The MACD cross and rising RSI suggest a relief bounce, but this looks like a rally within a downtrend that is likely to meet supply at the unfilled gap and the $303-$321 resistance.
This is educational analysis and not financial advice.