GOOGL 48-day bearish forecast — Nov 15, 2026
- Bias: Bearish
- Timeframe: 48 days (made Nov 15, 2026, target date Jan 1, 2027)
- Price at analysis: $295.77
- Price target: $290.00
- Expected range: $263.00 – $314.00
- Result: Pending — graded after the close on Jan 1, 2027
Get a free AI analysis of GOOGL today
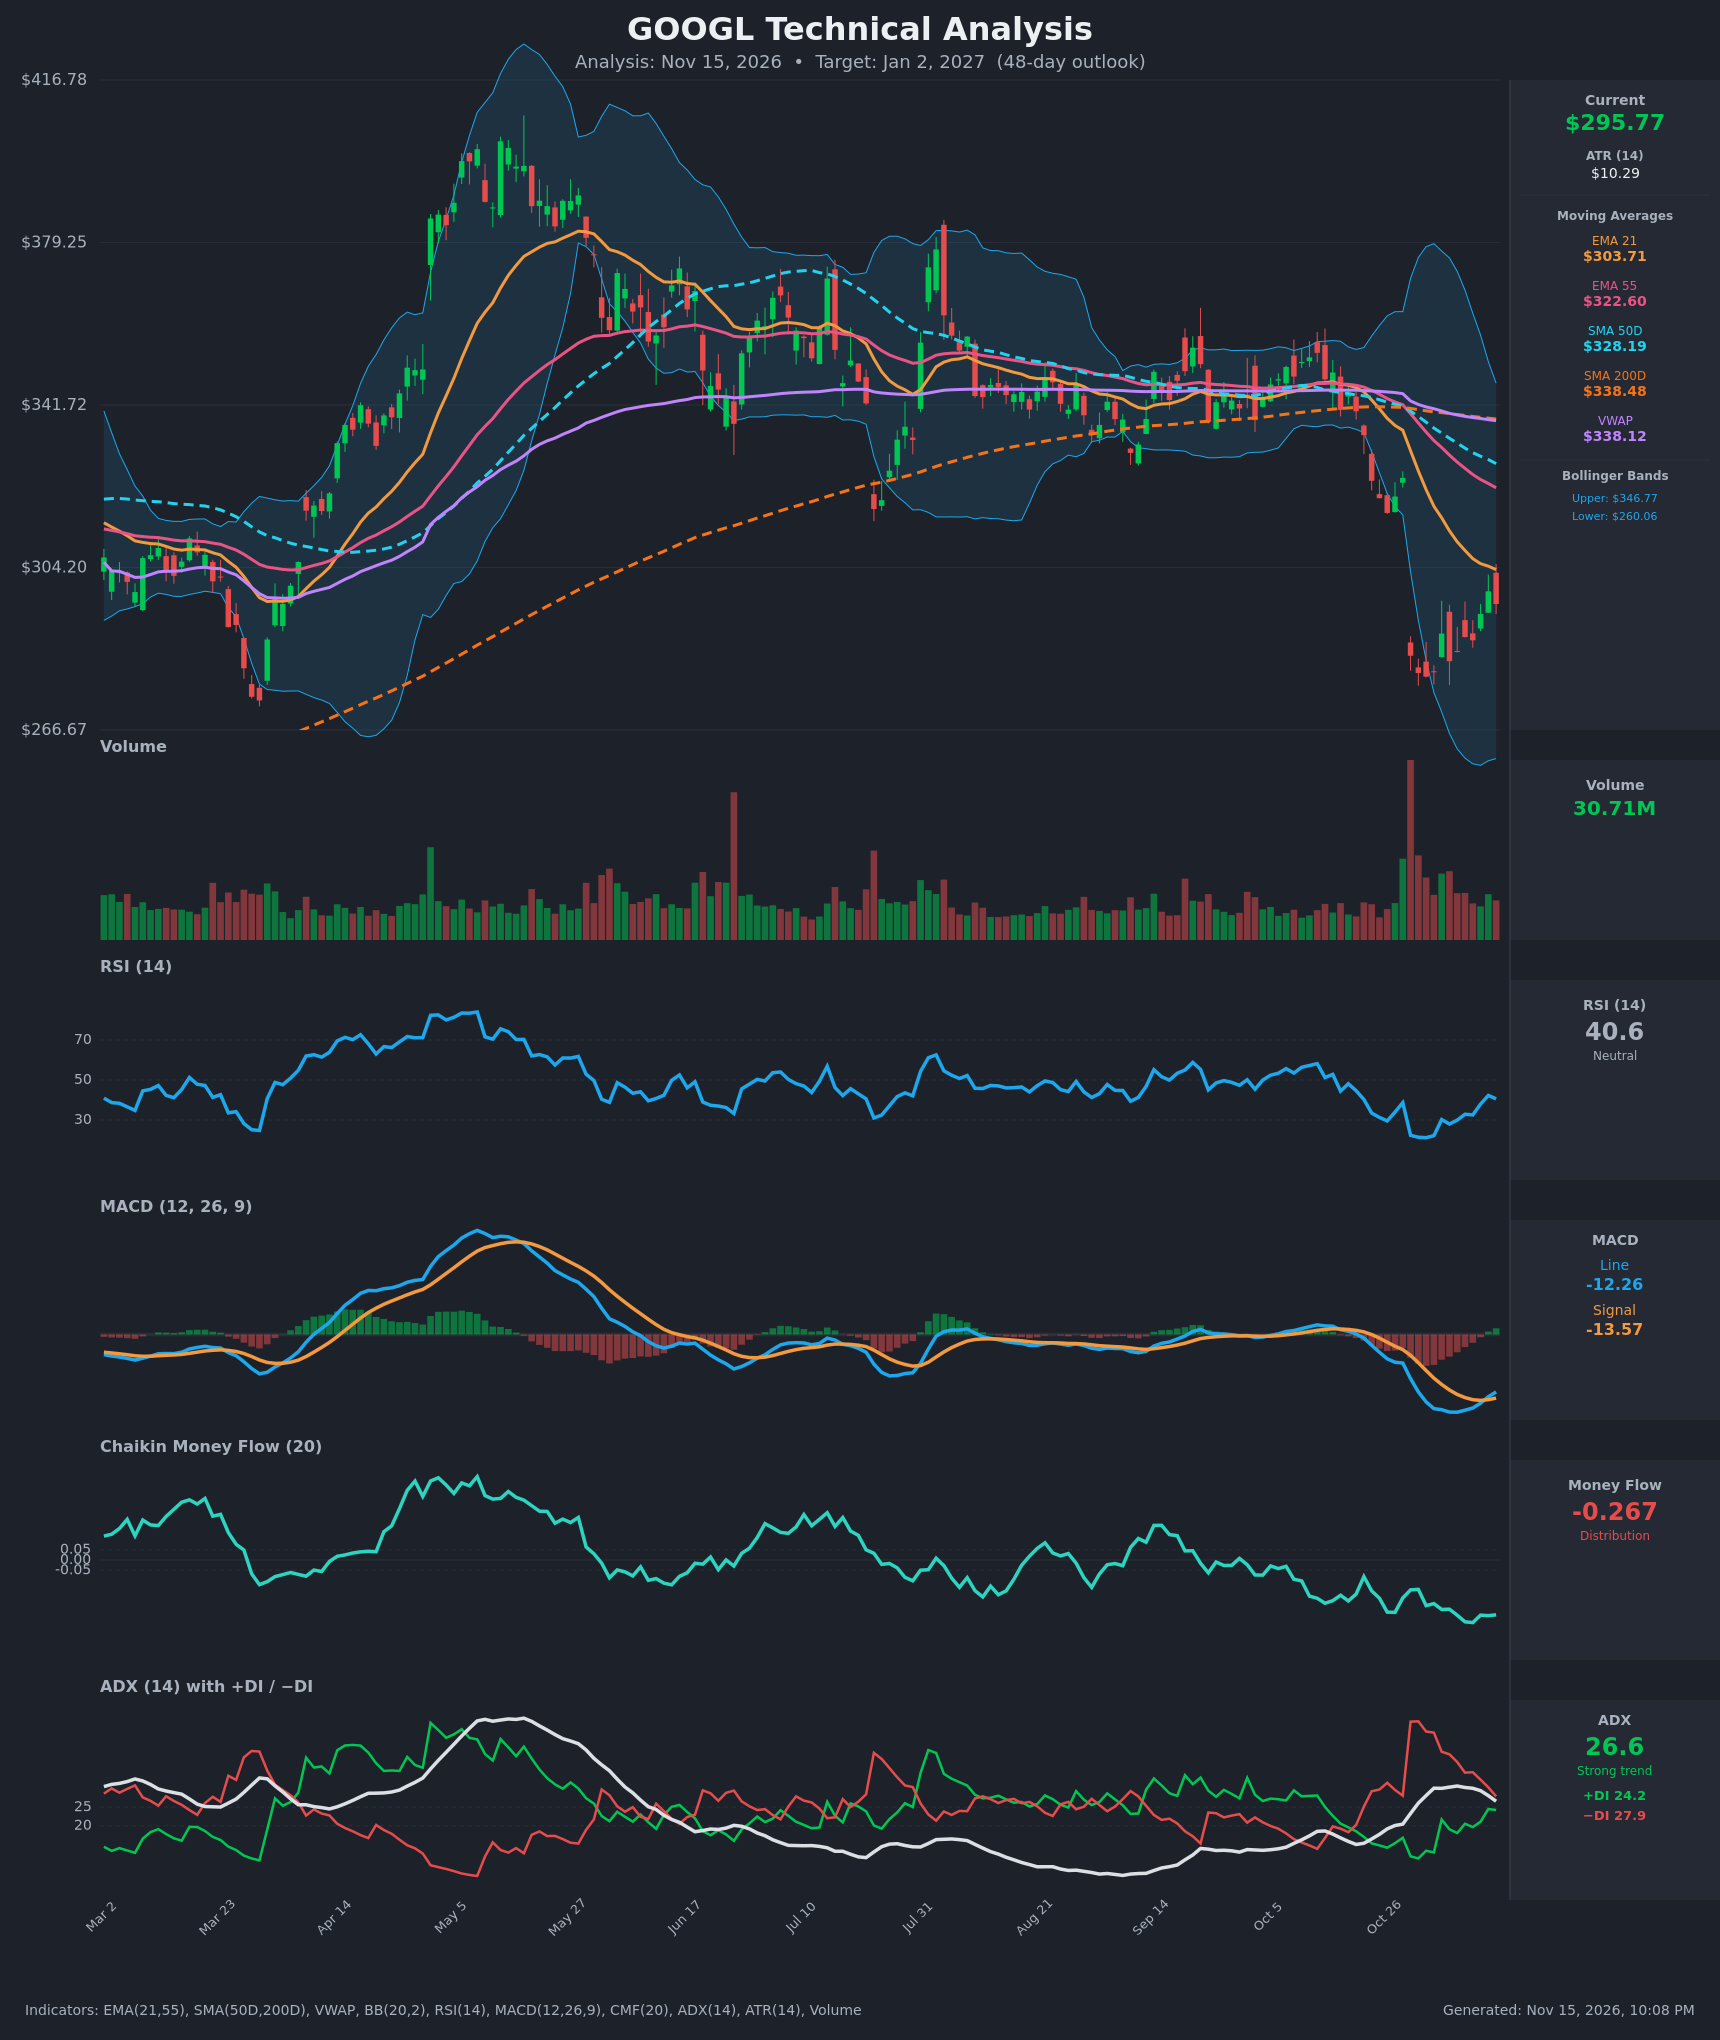
Analysis
TECHNICAL INDICATORS
- RSI (14): 40.58, recovering from deeply oversold readings (21.2 on Nov 2) but turned down from 42.3 on Nov 12. It is still below 50, so momentum is a bounce inside a weak structure. [Bearish]
- 20 EMA: The EMA 21 is at $303.71 and sloping down. Price at $295.77 is below it, and the EMA acted as resistance on the Nov 12 bounce to $298.70. EMA 21 is also below EMA 55 ($322.60), a bearish stack. [Bearish]
- MACD: The line is at -12.26 and the signal at -13.57. The line crossed above the signal around Nov 12, a bullish crossover, and the histogram is turning slightly positive. This happened deep below zero, so it is a relief bounce rather than a trend reversal. [Neutral]
- Bollinger Bands (20): Upper $346.77, lower $260.06, midline about $303.4. Price sits in the lower half, just below the midline, after riding the lower band during the Oct 29 to Nov 6 selloff. The bands are wide after the volatility spike. [Bearish]
- CMF (20): -0.267, well below -0.05 and near the lows of the whole chart. The bounce has come without buying pressure. [Distribution]
- ADX (14): 26.6 and falling from 30.7. −DI at 27.9 is still above +DI at 24.2, but the gap has narrowed from about 20 points to under 4. The trend is still active but losing strength, with a possible DI crossover ahead. [Strong Trend, Bearish, weakening]
- Volume: 30.71M is modest compared with the huge capitulation spike on the Oct 29 gap (-12.6%). Volume has been fading on the bounce, which is typical of a dead-cat bounce or early basing. [Neutral to mildly bearish]
DIVERGENCES & TRENDS
- Death cross: SMA50D ($328.19) is below SMA200D ($338.48), a death cross that has been in place since the chart's recent rollover. Price is below both, which is a long-term downtrend.
- MA stack: Price ($295.77) < EMA21 ($303.71) < EMA55 ($322.60) < SMA50D ($328.19) < SMA200D ($338.48) < VWAP ($338.12). This is a fully bearish structure with heavy overhead resistance.
- Momentum: RSI made a low at 21 and price made a low at about $279. A retest of that low with a higher RSI would be a bullish divergence, but it has not yet formed.
- MACD: The bullish signal-line cross is below zero and typically fails unless price reclaims the EMA 21/midline.
- CMF: It keeps making lower lows (-0.30 on Nov 9 to -0.267 now) while price bounces, a bearish divergence showing weak sponsorship.
- DI/ADX: Bearish control is fading, so selling pressure is easing. This supports consolidation more than fresh collapse.
CHART PATTERNS
- Bearish gap-down and a falling channel: The decline from about $360 to the lows near $279 matches a bearish continuation setup in which the bounce forms a Bearish Flag / Rising Wedge (see the reference diagram). The bounce from $279 to $298.70 is a modest upward-sloping retracement on declining volume.
- Possible base: The $279 to $289 lows (Oct 30, Nov 2, Nov 5) form a rough Double/Triple Bottom zone. Confirmation would need a close above about $299 to $304 (EMA 21 and the neckline), then above $325.
- Targets: A bearish flag measured move points to roughly $265 to $270. A bullish double-bottom measured move targets roughly $320 (neckline $299 plus $20 in height), but it faces heavy resistance from the MAs.
POTENTIAL SCENARIOS
- Scenario 1: Bearish Flag Failure and Retest of Lows — The bounce stalls at the EMA 21 (about $303) and the falling MAs. Sellers push price back through $279 on persistent distribution. Trigger: rejection at $299 to $304 and a close below $279. Target: $262 to $270, near the lower Bollinger Band. Invalidation: a daily close above $305. (40% probability)
- Scenario 2: Neutral Range Base Between $279 and $315 — Volatility compresses after the capitulation and ADX keeps falling. Price chops between the Oct lows and the EMA 21/EMA 55 zone. Trigger: holds above $279 with an inability to clear $315. Target: $285 to $305. Invalidation: close below $275 or above $322. (25% probability)
- Scenario 3: Bullish Double-Bottom Recovery — Oversold RSI, a MACD cross and a narrowing DI gap fuel a rebound toward the EMA 55 and the gap area. Trigger: close above $304 and then $315 on rising volume. Target: $320 to $330. Invalidation: close below $279. (35% probability)
PRICE TARGETS
For a 48-day timeframe (about 12-18% range width, 30-60 day guidance), the target leans modestly lower on distribution, downside trend alignment and heavy overhead resistance, tempered by oversold conditions.
- Target Price: $290.00 (about 2% below current, consistent with a bearish lean)
- Expected Range: $263.00 to $314.00 (width $51, about 17.2% of current price)
- Key Levels: Support at $279.00, Resistance at $303.71
OVERALL BIAS
OVERALL BIAS: BEARISH - Price remains below every key moving average with a death cross, CMF at -0.267 shows persistent distribution, and the bounce is fading on weak volume, so the $279 low is likely to be retested. Oversold RSI and a narrowing DI gap limit the downside, keeping conviction modest.
This is educational analysis and not financial advice.