GOOGL 62-day bullish forecast — Nov 15, 2026
- Bias: Bullish
- Timeframe: 62 days (made Nov 15, 2026, target date Jan 15, 2027)
- Price at analysis: $295.77
- Price target: $311.00
- Expected range: $272.00 – $332.00
- Result: Pending — graded after the close on Jan 15, 2027
Get a free AI analysis of GOOGL today
Analysis
TECHNICAL INDICATORS
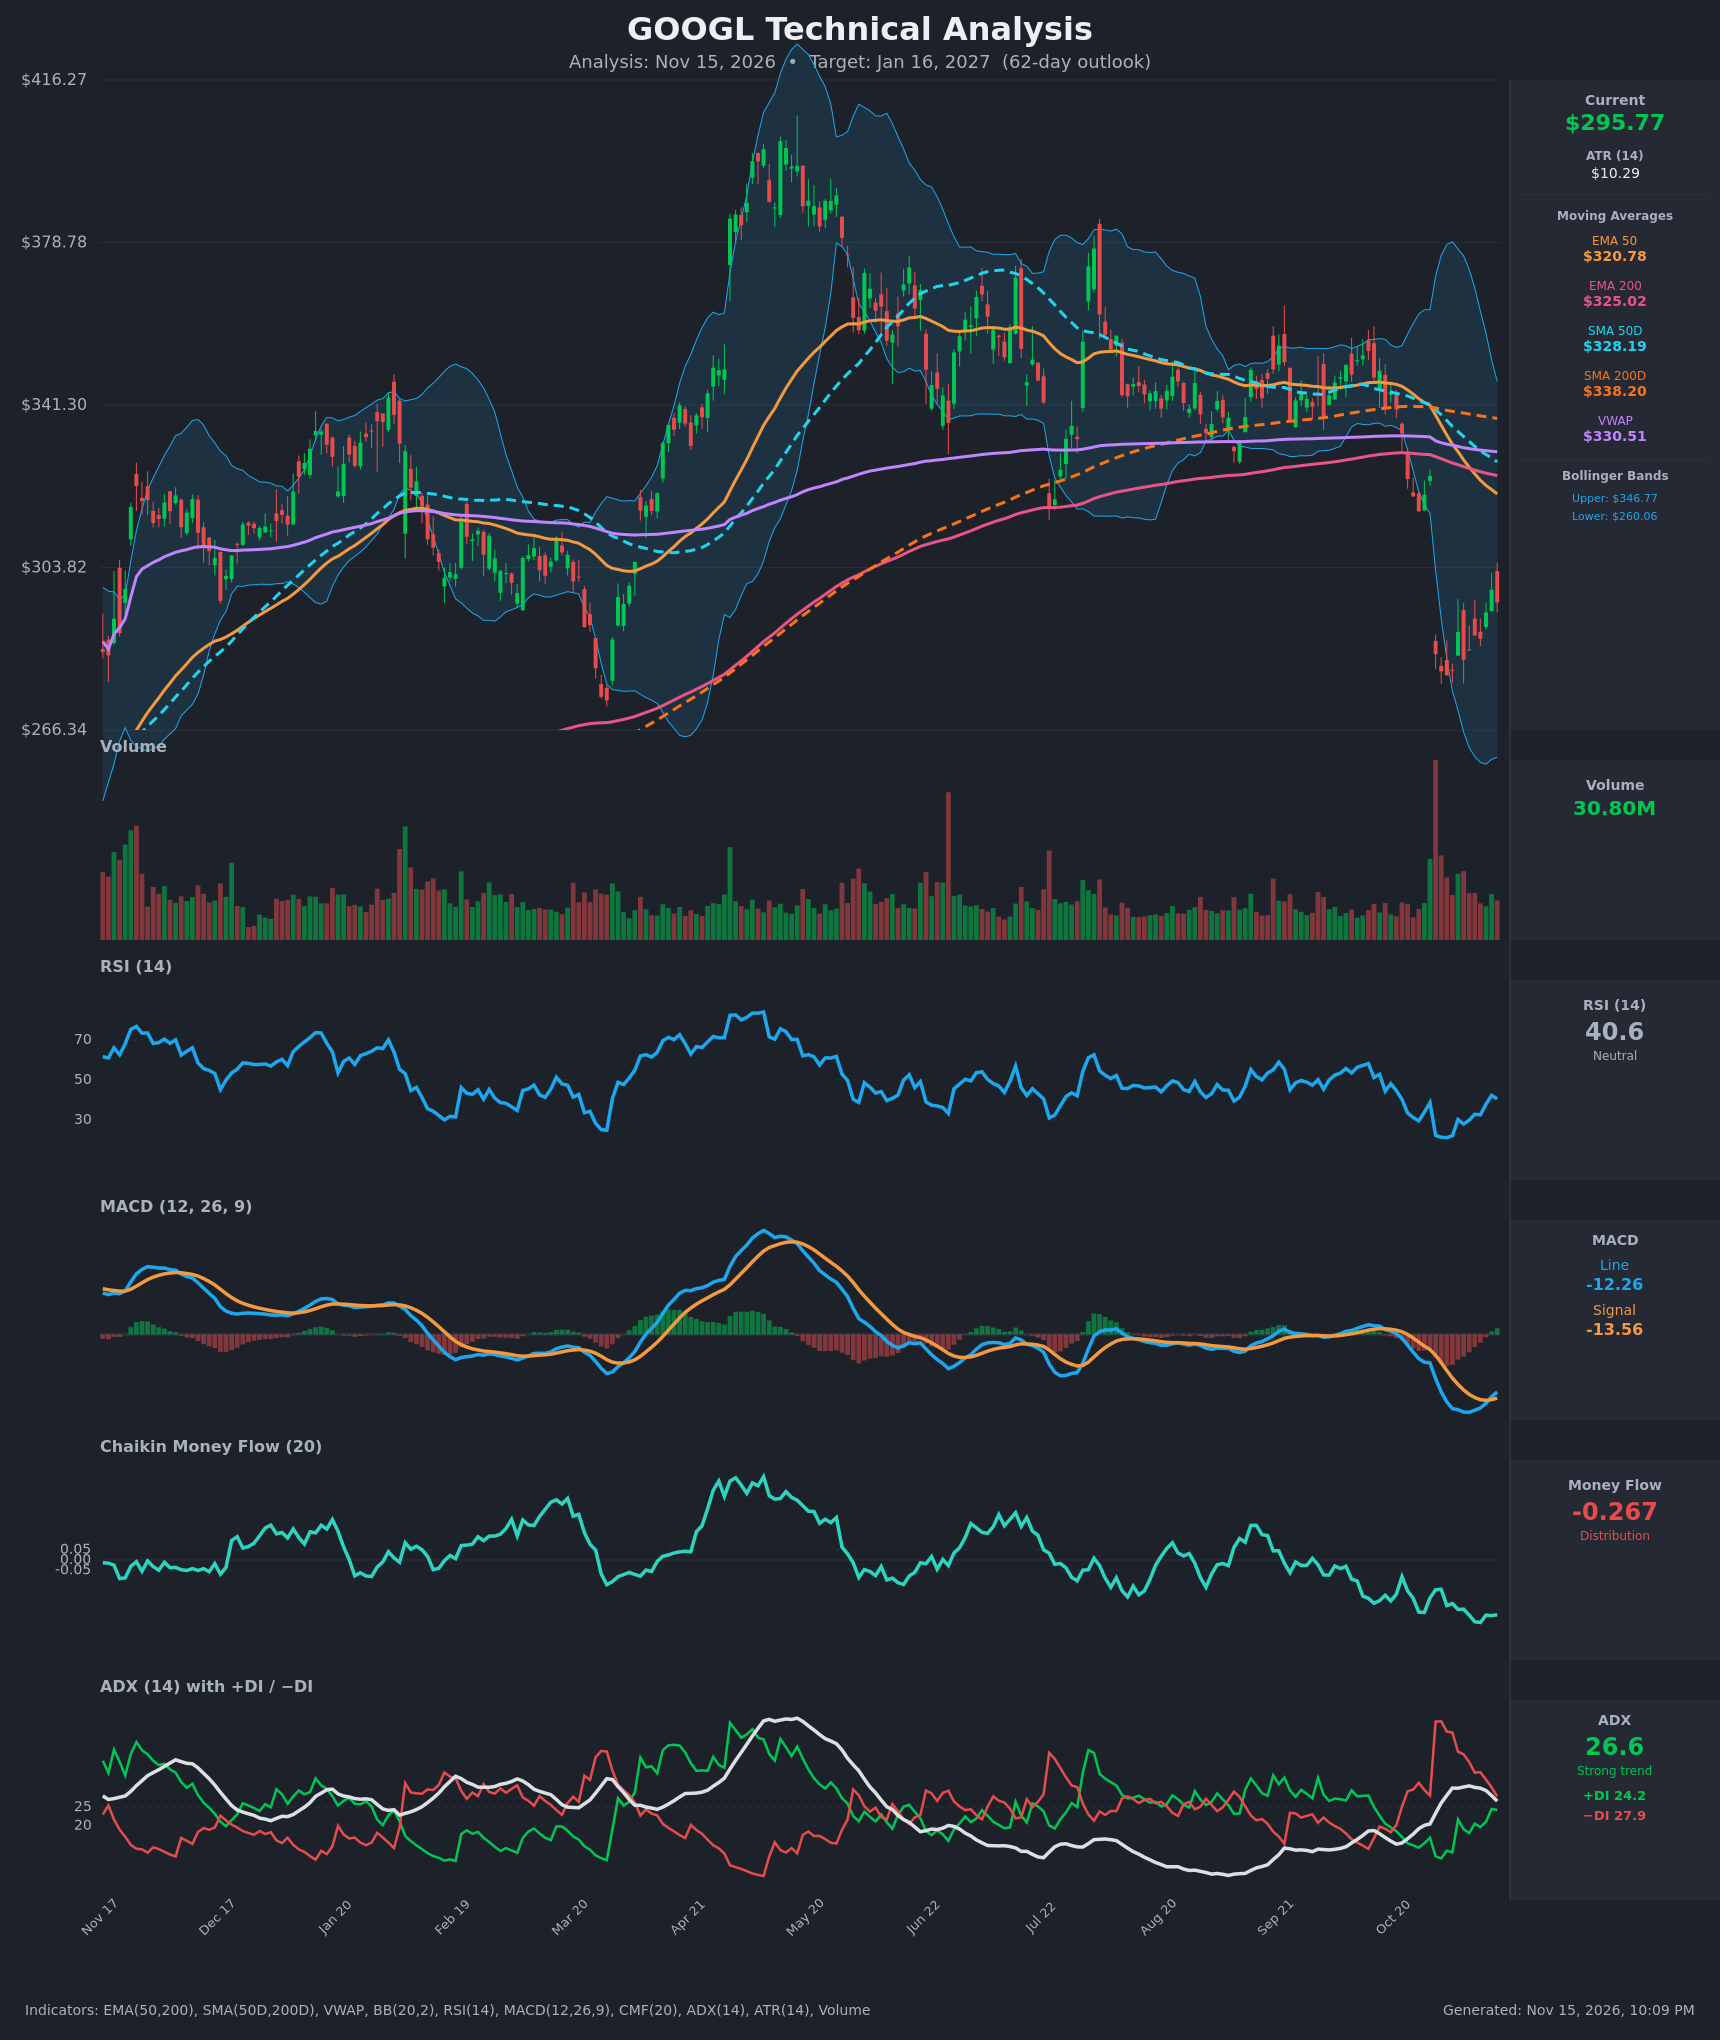
- RSI (14): 40.58, recovering from a deeply oversold 21.2 on Nov 2. It is rising but still below 50 and has not regained the neutral midline. [Neutral]
- 20 EMA: No 20 EMA value was supplied, so I use the Bollinger midline (the 20-period SMA, about $303.4) as a proxy, plus the supplied EMAs. Price at $295.77 is below the midline, below EMA 50 ($320.78) and below EMA 200 ($325.02). EMA 50 crossed below EMA 200 around Nov 9-10, which is a bearish cross. All of these act as overhead resistance. [Bearish]
- MACD: Line -12.26 has crossed above the signal at -13.56. The histogram is slightly positive (+1.3) and the line has been rising for 5 sessions. This is a bullish crossover, but it sits deep below zero and is a counter-trend bounce signal. [Bullish]
- Bollinger Bands (20): Upper $346.77, lower $260.06, midline about $303.4. Price tested the lower band in late Oct/early Nov after a volatility expansion and has bounced into the lower half. The bands are wide, so a mean-reversion move toward the midline is plausible. [Neutral]
- CMF (20): -0.267, well below -0.05 and making new lows even as price bounces. This shows persistent distribution and is the weakest part of the bounce. [Distribution]
- ADX (14): 26.6 and falling from 30.7, with -DI at 27.9 above +DI at 24.2. The trend is still technically strong and bearish, but the DI gap has narrowed from about 20 points to under 4, so the downtrend is losing strength. [Strong Trend, Bearish, but fading]
- Volume: 30.80M. The Oct 29 gap-down had a huge volume spike, which was capitulation-like. Volume on the bounce is moderate and doesn't confirm strong buying. [Neutral to slightly Bearish]
DIVERGENCES & TRENDS
- Price vs RSI: Price retested its low area (278.99, then 282.57 and 284.78) while RSI rose from 21 to 28-30 and then to 40. This is a mild bullish divergence.
- Price vs CMF: CMF keeps falling (-0.14 to -0.30) while price bounces. This is a bearish divergence, so the rally lacks accumulation.
- Moving averages: The SMA 50 ($328.19) is below the SMA 200 ($338.20), a death cross. Price is far below the SMA 200, which confirms a long-term downtrend break after the run to about $416.
- MACD: The bullish crossover on Nov 12 is a recent improvement, but the line is still deeply negative.
- ADX/DI: -DI is falling from 48 to 28 and +DI is rising from 11 to 24. A bullish DI crossover is close, though not yet confirmed.
- VWAP: Price is about 10% below the $330.51 VWAP, a stretched condition that often draws mean-reversion bounces.
CHART PATTERNS
- Bullish Double Bottom (developing): Lows near $279 (Nov 2) and $282.6 (Nov 5), with a neckline around $298-300 (the Nov 12 high of $298.70). A close above about $300 would project roughly $300 + $20 = about $320. Price is just under the neckline, so this is unconfirmed.
- Bearish risk (flag-like drift): After the sharp Oct 29 gap, a weak, low-volume rebound that fails near $300-305 would fit a bearish flag or pennant continuation, with a measured move toward the mid-$250s.
- Overall: The pattern is mixed. A base is forming, but the larger structure is lower highs below falling MAs.
POTENTIAL SCENARIOS
- Scenario 1: Bullish Double-Bottom Recovery — Price completes the base, breaks the $300 neckline and rallies toward the Bollinger midline and falling EMAs, partially filling the gap from $324. Trigger: daily close above $300 with a bullish DI crossover and MACD histogram expanding. Target: $310-$320. Invalidation: close below $279. (45% probability)
- Scenario 2: Bearish Continuation Lower — The bounce fails at $303-$310 resistance (Bollinger midline), and persistent distribution (CMF -0.27) pushes price back to the lows and below them. Trigger: rejection at $300-$310 and a break below $279. Target: $260 (lower Bollinger band), with an extension toward $250. Invalidation: close above $321 (EMA 50). (40% probability)
- Scenario 3: Neutral Range Chop — Price oscillates between $279 and $310 as the ADX fades and the DI lines converge. Trigger: repeated failures at both $300 and $285. Target: $290-$300. Invalidation: a close beyond $279 or $321. (15% probability)
PRICE TARGETS
- Target Price: $311.00 (62-day horizon, about +5.2%)
- Expected Range: $272.00 to $332.00 (width $60, about 20.3% of current price, consistent with the 61-180 day guidance)
- Key Levels: Support at $279.00, Resistance at $320.78
OVERALL BIAS
OVERALL BIAS: BULLISH - The oversold bounce is supported by a bullish MACD crossover, a developing double bottom, narrowing DI spread, and a stretched price far below VWAP and the Bollinger midline. The edge is modest. Distribution (CMF -0.27), the death cross, and price below all major MAs keep a bearish retest (about 40%) very live, and a loss of $279 would invalidate this view.
This is educational analysis and not financial advice.