GOOGL 4-day bearish forecast — Nov 1, 2026
- Bias: Bearish
- Timeframe: 4 days (made Nov 1, 2026, target date Nov 4, 2026)
- Price at analysis: $279.76
- Price target: $277.50
- Expected range: $272.00 – $285.00
- Result: Incorrect (+4.3%) — closed at $291.70 on Nov 4, 2026; quality score 7/100
Get a free AI analysis of GOOGL today
Analysis
TECHNICAL INDICATORS
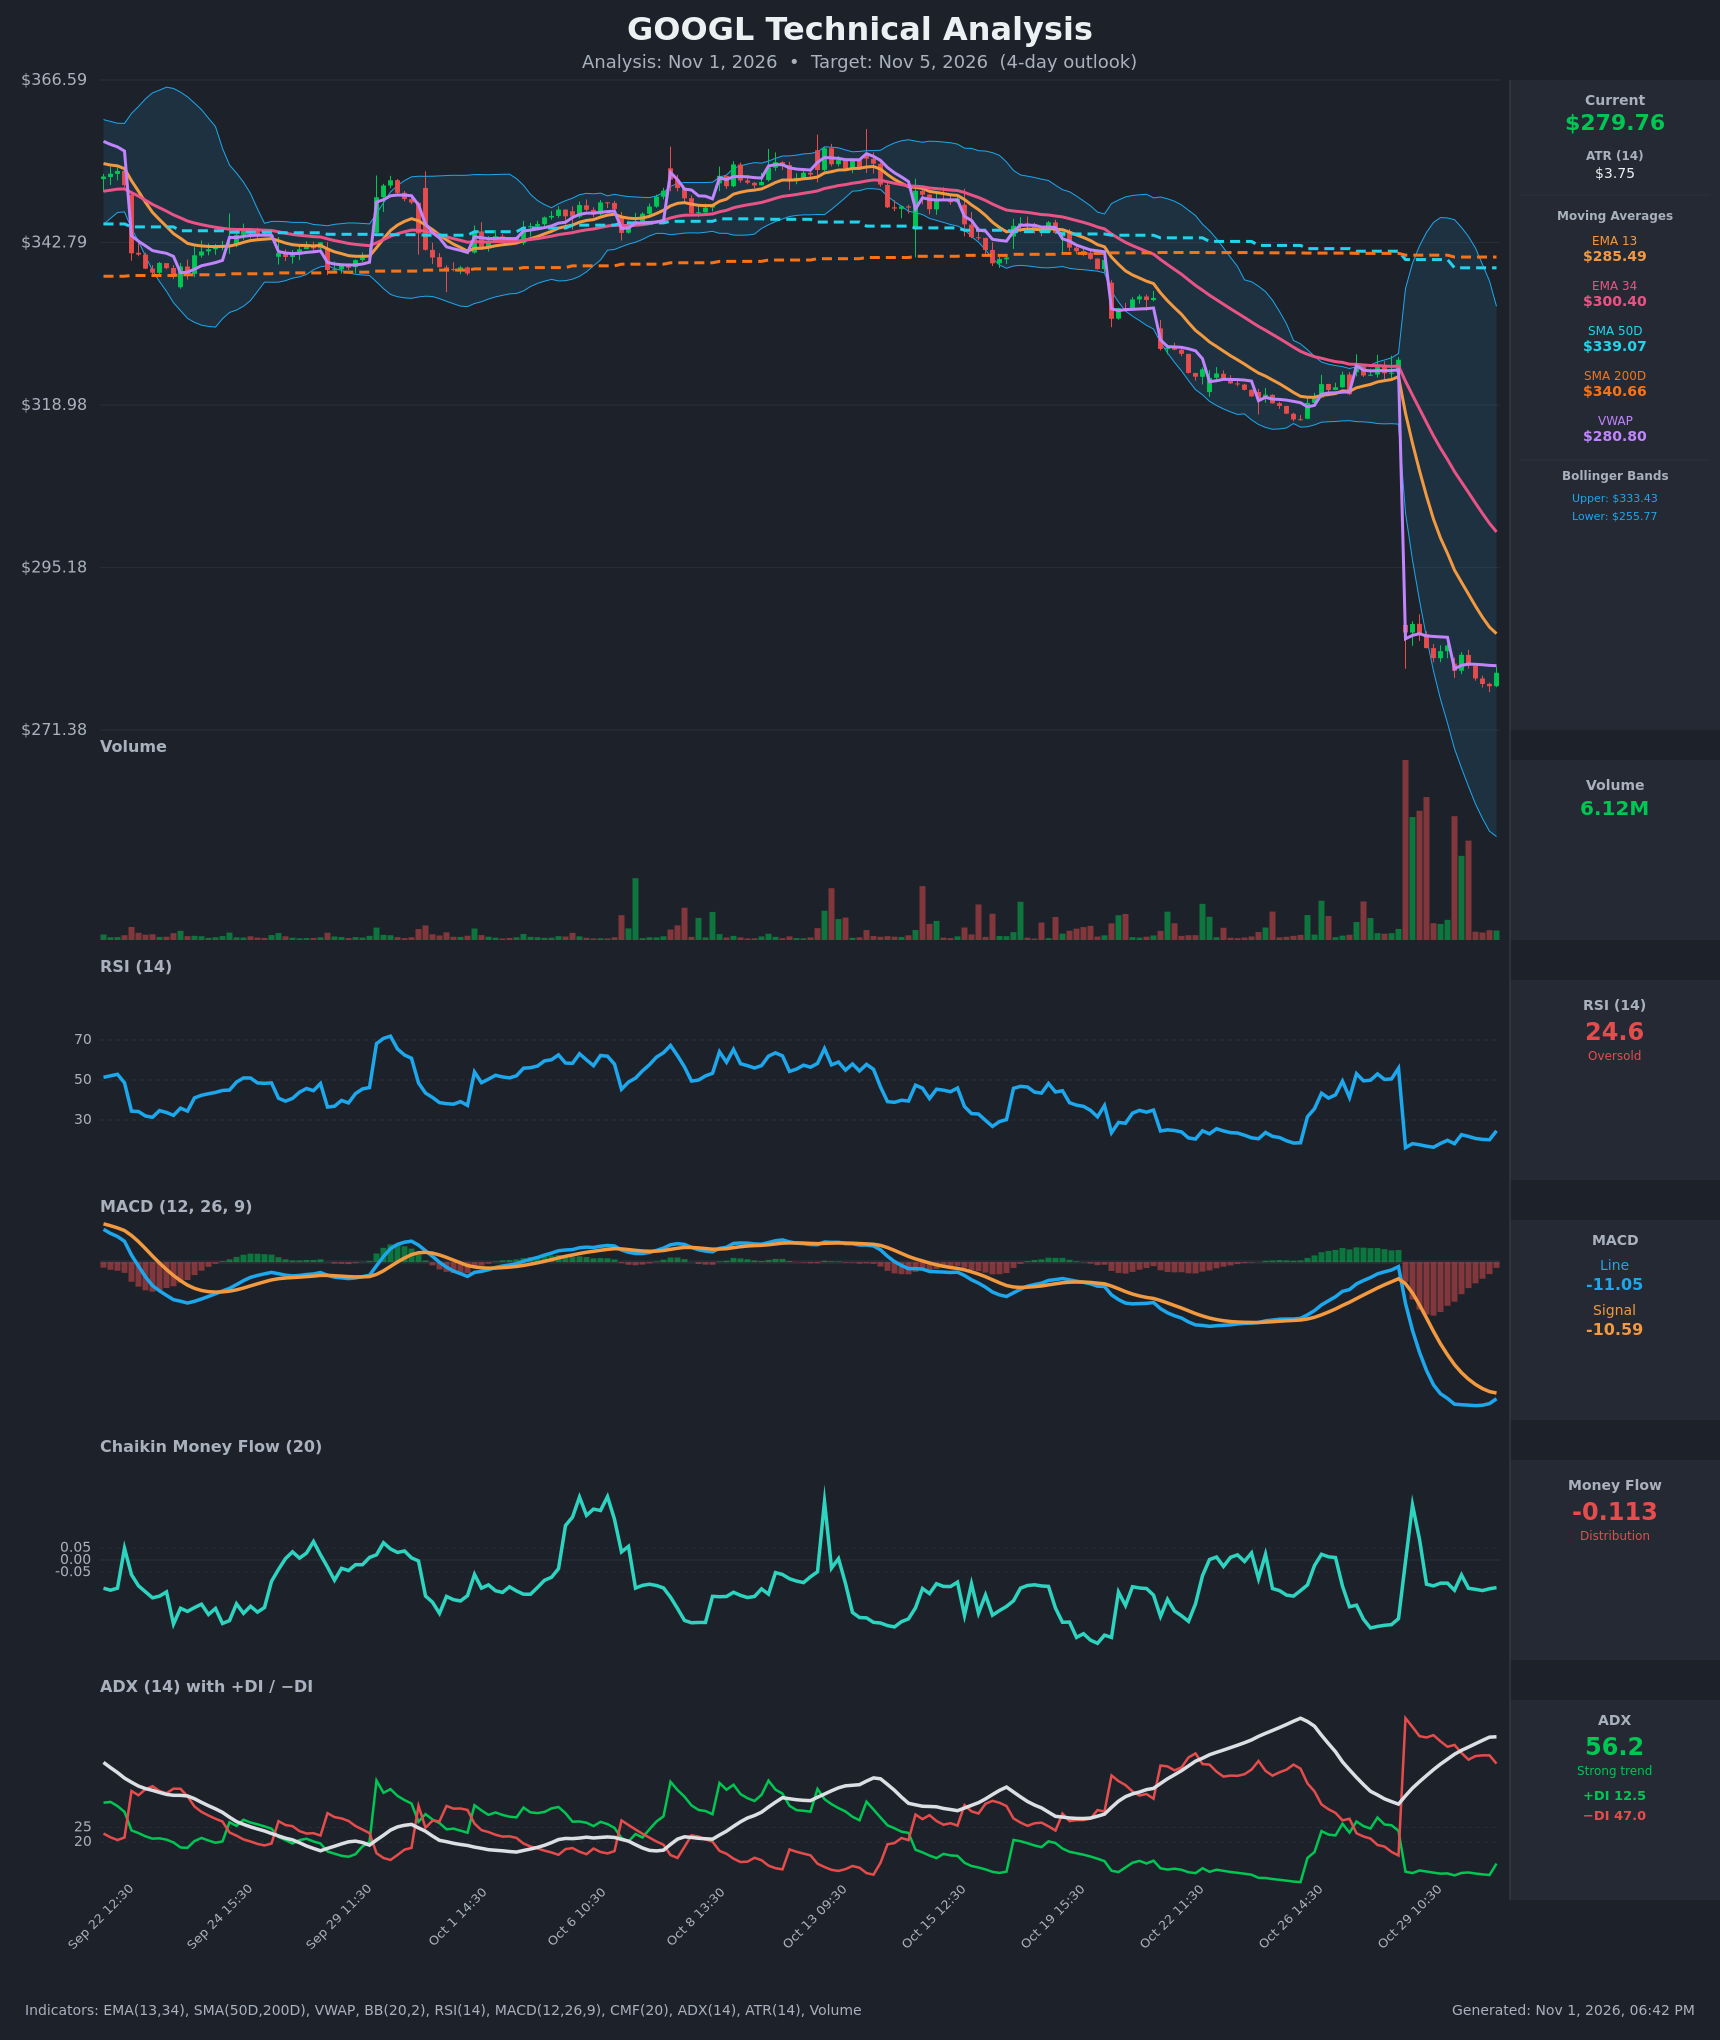
- RSI (14): 24.60, oversold. It bottomed at 16.2 on the Oct 29 gap and has hovered at 16-24 since, with the latest bar ticking up from 20.1. Momentum is washed out, but there is no bullish divergence in the price lows. [Neutral]
- 20 EMA: The chart shows EMA 13 at $285.49 and EMA 34 at $300.40. Price ($279.76) is below both, and both are sloping down, so they act as overhead resistance. EMA13 is below EMA34 and the gap is widening. [Bearish]
- MACD: Line -11.05 vs signal -10.59, histogram about -0.46. The line has been flattening and hooking up, so the negative histogram is shrinking. There is no bullish crossover yet, and it sits deep below zero. [Bearish]
- Bollinger Bands (20): Upper $333.43, lower $255.77. The bands are extremely wide after the gap. Price is in the lower half of the bands, about $24 above the lower band, and has stopped walking it. Volatility is expanded and the bands are not yet contracting. [Neutral]
- CMF (20): -0.113, below -0.05. It has been consistently negative apart from a brief spike on the gap day, so selling pressure still dominates. [Distribution]
- ADX (14): 56.2 and rising, with −DI 47.0 above +DI 12.5. This is a very strong, mature bearish trend. A reading this extreme often precedes consolidation or a snap-back, but it gives no reversal signal by itself. [Strong Trend, Bearish]
- Volume: 6.12M, far below the gap-day spike. Volume has faded sharply into the drift lower, so there is no fresh capitulation. This suggests a low-volume bearish drift or a base-building pause rather than panic. [Neutral-to-Bearish]
Other levels:
- Price is below VWAP ($280.80), a slight bearish tilt.
- Price is far below SMA50 ($339.07) and SMA200 ($340.66). The 50D/200D are converging and a death cross looks imminent.
DIVERGENCES & TRENDS
- There is no clear bullish price/RSI divergence. Price set a lower low ($277.80) while RSI bottomed at 20.1, above its 16.2 gap-day low. This is a minor momentum improvement, not a confirmed divergence.
- Since the gap, intraday highs have stepped down: $286.92, $283.75, $282.40, $280.82. Closes have drifted down from $285.67 to about $278-280.
- MACD momentum is decelerating, with the histogram shrinking. This points to slowing downside, not a reversal.
- EMA13 < EMA34 < SMA50 < SMA200 is a fully bearish stack. The gap-down erased the earlier EMA/price alignment.
- RSI is turning up from oversold, and the last bar bounced off the $277.80 low, so a relief rally toward VWAP or EMA13 is plausible.
- +DI ticked up from 8.6 to 12.5, a first sign of buyers. It is still far below −DI.
CHART PATTERNS
- Bearish Flag / Pennant after a gap-down: After the vertical drop from about $325 to $285, price has consolidated in a tight, downward-sloping channel ($277.80-$287). The reference diagram's Bearish Flag/Pennant implies continuation lower on a break of the lower boundary. The measured-move implication is large (the pole is about $40), but over 4 days a realistic target is only a modest extension below $277.80.
- Gap-and-drift: The gap was never filled, and the overhead gap zone ($285-$325) is heavy resistance.
- There is no confirmed reversal pattern such as a double bottom. A bounce would first need to reclaim VWAP and EMA13.
POTENTIAL SCENARIOS
- Scenario 1: Bearish Flag Continuation — Price keeps making lower highs and breaks the $277.80 low, with the strong trend (ADX 56, −DI dominant, negative CMF) extending the post-gap drift. Trigger: close below $277.80. Target: $272-$275. Invalidation: close above $286 (EMA13). (50% probability)
- Scenario 2: Bullish Oversold Relief Bounce — RSI at 24.6 and a shrinking MACD histogram fuel a mean-reversion bounce to VWAP and EMA13. Trigger: reclaim of $281 with a rising +DI. Target: $285-$287. Invalidation: rejection at $285.50 and a move back below $278. (33% probability)
- Scenario 3: Neutral Sideways Base — Price chops between $277 and $283 on fading volume while the indicators reset. Trigger: failure to break either $277.80 or $283. Target: $278-$282. Invalidation: a decisive close outside $276-$286. (17% probability)
PRICE TARGETS
Range width check: $285.00 - $272.00 = $13.00, which is 4.65% of $279.76. That is appropriate for a 4-day horizon, wider than a 2-3 day range (2-4%) and narrower than a 7-10 day range (4-8%). It is also about 3.5x ATR ($3.75).
- Target Price: $277.50 (4 days from now)
- Expected Range: $272.00 to $285.00
- Key Levels: Support at $277.80, Resistance at $285.49
OVERALL BIAS
OVERALL BIAS: BEARISH - Price sits below the entire moving-average stack. ADX is 56 with −DI dominant, CMF shows distribution, and post-gap highs keep stepping lower in a bear-flag structure. The oversold RSI and shrinking MACD histogram make a relief bounce toward $285 a real risk, so conviction is modest and the expected downside is limited to about $277.50.
This is educational analysis and not financial advice.