AAL 4-day bullish forecast — Nov 1, 2026
- Bias: Bullish
- Timeframe: 4 days (made Nov 1, 2026, target date Nov 4, 2026)
- Price at analysis: $12.61
- Price target: $12.72
- Expected range: $12.38 – $12.88
- Result: Correct (+8.2%) — closed at $13.65 on Nov 4, 2026; quality score 50/100
Get a free AI analysis of AAL today
Analysis
TECHNICAL INDICATORS
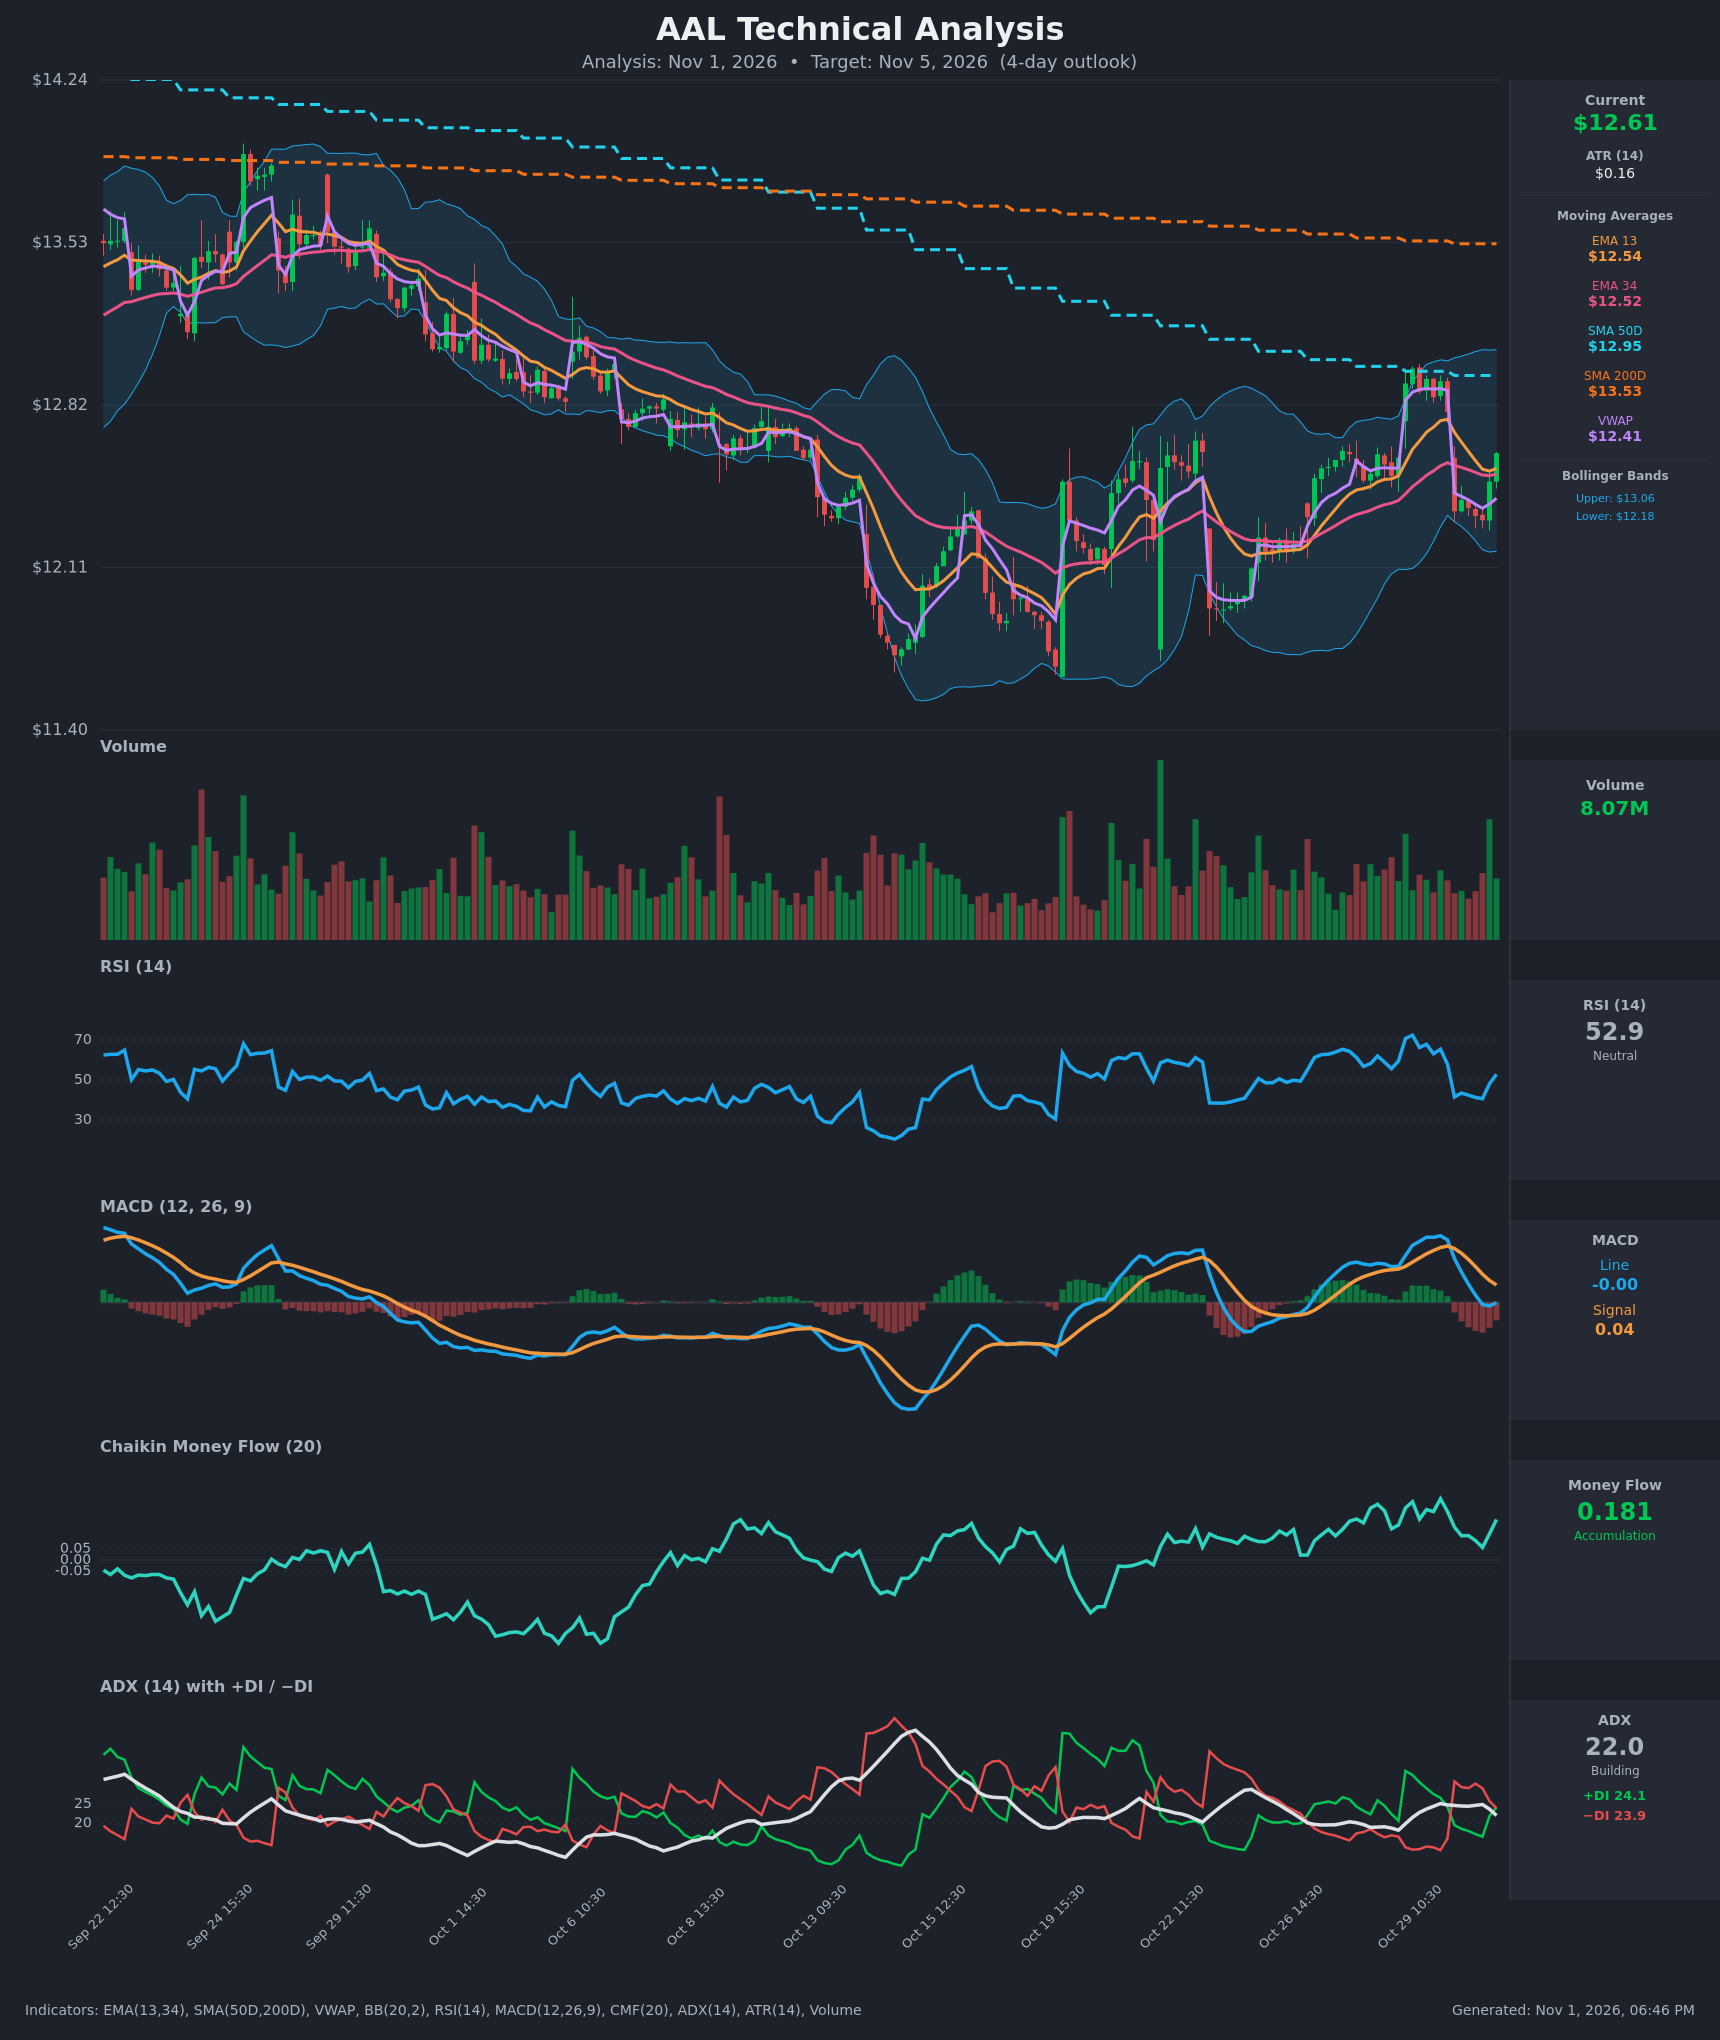
- RSI (14): 52.87, recovering from about 40.7 three bars ago and back above the 50 midline. Momentum is turning up from a neutral base, with no overbought or oversold condition. [Bullish]
- 20 EMA: The supplied values are EMA 13 at $12.54 and EMA 34 at $12.52. Price at $12.61 is above both, and the 13 is just above the 34 after dipping toward it. The short-term cushion is thin but intact. [Bullish]
- MACD: Line -0.0009 vs. signal 0.0409, so the line is still below the signal. The histogram is about -0.042 and has shrunk from about -0.071 over the last three bars. Bearish momentum is fading, but no bullish crossover has happened yet. [Neutral]
- Bollinger Bands (20): Upper $13.06, lower $12.18, midline about $12.62. Price sits right on the midline after bouncing from the lower half of the band. The bands are moderately wide, so there is room to move either way. [Neutral]
- CMF (20): 0.181, well above +0.05 and in persistent positive territory. Buying pressure has held through the recent gap-down and bounce. [Accumulation]
- ADX (14): 22.0 and falling from about 25, with +DI 24.1 just above −DI 23.9 after a bearish flip on Oct 30. The trend is weak and nearly balanced, with a slight edge to bulls. [Weak Trend, slight bullish tilt]
- Volume: 8.07M on the latest bar. That is above the recent average and comes with a green up-bar, which suggests buyers stepped in on the bounce. The earlier gap-down also came on heavy volume. [Mildly Bullish]
Moving-average context:
- Price is above VWAP ($12.41), which is a short-term positive.
- Price is below SMA50 ($12.95) and SMA200 ($13.53), so the longer-term trend is still down.
- SMA50 is below SMA200, so a death-cross configuration remains in place.
DIVERGENCES & TRENDS
- Fading bearish momentum: The MACD histogram has narrowed for three straight bars while price climbed from $12.32 to $12.61. RSI is rising from about 41 to 53. Both point to a short-term momentum turn, though the MACD has not crossed up yet.
- DI crossover: +DI has just crossed back above −DI (24.1 vs. 23.9). The margin is tiny and ADX is below 25, so this is a tentative signal.
- CMF vs. price: CMF stayed strongly positive (0.06–0.18) while price dropped on Oct 30. That shows no distribution behind the selloff, a mild bullish divergence.
- Rejection at SMA50: The Oct 29 spike to about $12.98 was rejected at SMA50 ($12.95) and the upper Bollinger Band, then fully faded in a gap-down. Overhead supply is real.
- Longer-term structure: The downtrend from the Sep high near $14 has been replaced by a higher-low base around $11.8–$12.2 since mid-October. SMA200 is still falling, so the larger trend remains bearish.
CHART PATTERNS
- Potential Bullish Double Bottom (incomplete): The mid-October lows near $11.8–$12.0 form two troughs. The neckline is around $12.95–$13.0, which also matches SMA50 and the Oct 29 high. A close above that would project toward roughly $14, but that is well beyond a 4-day horizon.
- Range / Symmetrical consolidation: Since Oct 19, price has traded between about $12.1 and $13.0 with ADX below 25. This favors range behavior in the near term.
- Gap-down failure (Oct 30): The gap partly filled, with price recovering about half the drop. The unfilled gap near $12.79–$12.93 is the logical near-term upside target.
- No high-conviction pattern from the reference diagram is confirmed. The double bottom needs a break of the neckline.
POTENTIAL SCENARIOS
- Scenario 1: Bullish Gap-Fill Grind Higher — Price holds above the EMAs and VWAP while MACD crosses above its signal line, and CMF accumulation drives a move toward the Oct 29 gap area. Trigger: hold above $12.52 and a break above $12.70. Target: $12.79 first, then $12.90–$12.95 (SMA50). Invalidation: a close below $12.40. (45% probability)
- Scenario 2: Neutral Range Chop — Price oscillates around the Bollinger midline and EMAs as ADX stays below 22. Trigger: failure to clear $12.75 and failure to lose $12.45. Target: $12.45–$12.75. Invalidation: a close above $12.85 or below $12.35. (25% probability)
- Scenario 3: Bearish Rejection and Retest of Lows — The bounce fades under resistance, MACD rolls over, and −DI retakes control. Trigger: a close below $12.50 (EMA 34), with VWAP at $12.41 as the next test. Target: $12.30, then the lower band at $12.18. Invalidation: a close above $12.80. (30% probability)
PRICE TARGETS
Timeframe: 4 days (Nov 5, 2026). With ATR of $0.16, a one-standard-deviation 4-day move is about $0.32. The range sits between the 3-day and 7-day guidance, at about 4% width.
- Target Price: $12.72
- Expected Range: $12.38 to $12.88 (width $0.50, about 4.0% of current price)
- Key Levels: Support at $12.52, Resistance at $12.95
OVERALL BIAS
OVERALL BIAS: BULLISH - The MACD histogram is narrowing, RSI is recovering above 50, CMF shows accumulation, and price is above the EMAs and VWAP with +DI barely on top. A move toward the unfilled gap near $12.80 is the most likely outcome. Upside is capped by SMA50 at about $12.95 and a still-bearish long-term structure below SMA200, so conviction is modest.
This is educational analysis and not financial advice.