AAL 34-day bullish forecast — Nov 15, 2026
- Bias: Bullish
- Timeframe: 34 days (made Nov 15, 2026, target date Dec 18, 2026)
- Price at analysis: $13.17
- Price target: $13.65
- Expected range: $12.20 – $14.40
- Result: Pending — graded after the close on Dec 18, 2026
Get a free AI analysis of AAL today
Analysis
TECHNICAL INDICATORS
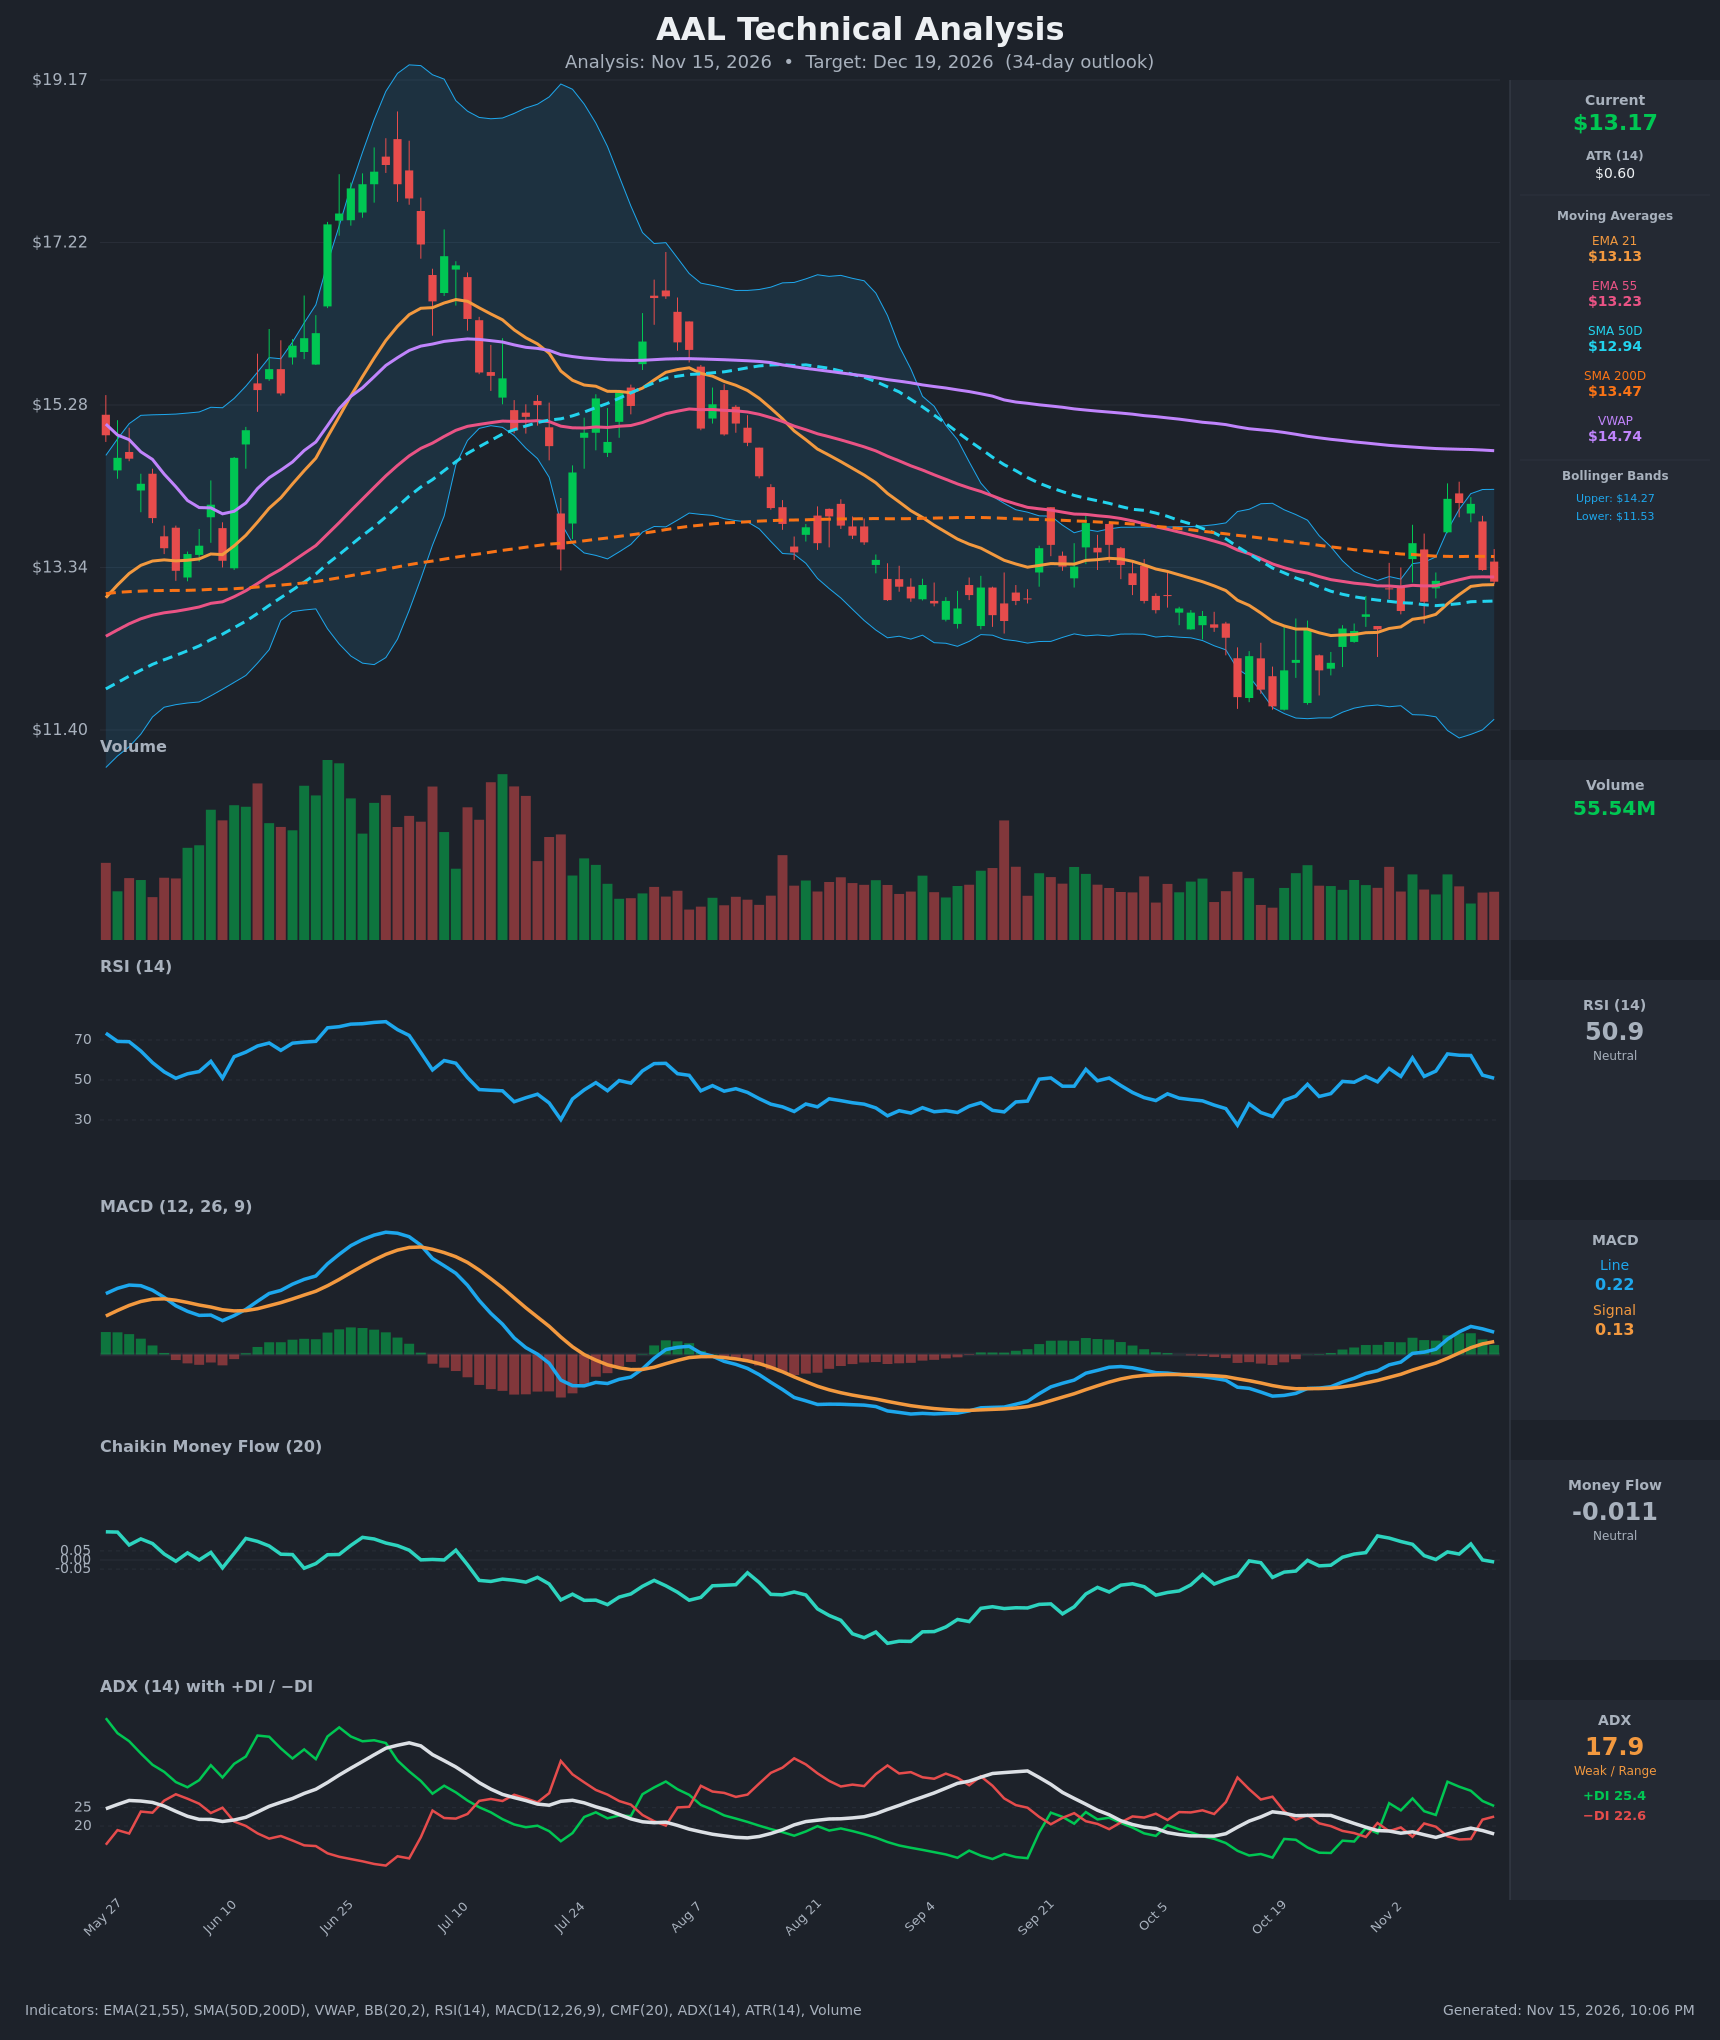
- RSI (14): 50.89, neutral. It has fallen from 63 on Nov 9 to about 51 as price gave back the breakout spike. It has stayed above its October lows near 30, so momentum has reset rather than broken. [Neutral]
- 20 EMA: EMA 21 is $13.13 and price ($13.17) sits just above it, so the EMA is acting as thin support. EMA 21 is rising and flattening against EMA 55 ($13.23), which is still marginally above it. A bullish EMA 21/55 cross is close but not confirmed. [Neutral]
- MACD: The line (0.223) is above the signal (0.129), and both are above zero after a bullish cross on Nov 10. The histogram has shrunk from about 0.17 on Nov 11 to about 0.09, so upside momentum is fading. The line is also turning down (0.280 to 0.223). [Bullish]
- Bollinger Bands (20): Upper $14.27, lower $11.53, midline about $12.90. Price is slightly above the midline after being rejected near the upper band at $14.16 on Nov 9. The bands are wide but starting to contract, which suggests range-bound volatility. [Neutral]
- CMF (20): -0.011, between ±0.05. It has drifted down from +0.088 on Nov 11 and just crossed zero, so there is no clear accumulation or distribution. [Neutral]
- ADX (14): 17.9 (weak, below 20) with +DI 25.4 above −DI 22.6. Bulls are slightly in control, but the gap has narrowed from about 15 points to under 3. There is no established trend. [Weak Trend, slight bullish lean]
- Volume: 55.54M, around average. Volume has been much lower since the June–July high, and the Nov 9 spike was not followed by strong volume. The pullback on average volume suggests neither side is dominant. [Neutral]
DIVERGENCES & TRENDS
- Price made a higher low in October–November, with the late-October low around $11.6–12.0 well above the key bottoms earlier in the year. RSI and MACD show similar higher lows, so there is a mild bullish structure but no clean divergence.
- MACD is above its signal, but the histogram is shrinking while price pulls back. This is early momentum fatigue, not a bearish cross yet.
- The longer-term trend is still down. Price is below the SMA200 ($13.47, flat to declining) and far below VWAP ($14.74), and the June peak near $18.50 was followed by a lower-high sequence.
- SMA50 ($12.94) has turned up and is now below price. It is rising toward the flat SMA200, but a golden cross is not imminent.
- EMA 21 is converging with EMA 55, and a bullish cross is possible in the coming days.
- DI spread and ADX are both compressing, which points to consolidation.
CHART PATTERNS
- Bullish Double Bottom / early base: The two October lows near $11.6–12.0, followed by a bounce to $14.16, resemble a double bottom. The neckline is around $14.1–14.2, the Nov 9–11 high. A close above it targets roughly $16.5–16.7 (neckline plus pattern depth), but that is a longer-term objective and not a 34-day target.
- Range / consolidation: Price is pinned between SMA50/EMA support (~$12.95–13.13) and SMA200/VWAP resistance ($13.47–14.74). The pattern is incomplete until $14.2 is cleared.
- The current pullback from $14.16 looks like a corrective retest of the breakout area, similar to a Bullish Flag or Pennant shape. Confirmation needs a move back above $13.47.
POTENTIAL SCENARIOS
- Scenario 1: Bullish Base Retest and Breakout Attempt — Price holds the EMA21/SMA50 zone, MACD re-expands, and price reclaims the SMA200, then pushes back toward the November high. Trigger: daily close above $13.47 (SMA200) with +DI widening. Target: $14.20–$14.60. Invalidation: daily close below $12.90 (SMA50). (45% probability)
- Scenario 2: Bearish Rejection at the 200-Day — The MACD histogram keeps shrinking and a bearish cross follows, with RSI below 45. Price loses the EMAs and SMA50, then retests the lower range. Trigger: close below $12.94 with −DI crossing above +DI. Target: $12.00, then $11.55 (lower Bollinger Band). Invalidation: close above $13.75. (30% probability)
- Scenario 3: Neutral Range Chop — Weak ADX (<20) keeps price oscillating around the converged moving averages. Trigger: failure to break either $12.90 or $13.75 for several weeks. Target: $12.80–$13.90. Invalidation: decisive break of either boundary. (25% probability)
PRICE TARGETS
- Target Price: $13.65 (34-day horizon, about +3.6%)
- Expected Range: $12.20 to $14.40 (width $2.20, about 16.7% of current price, in line with the 30–60 day guidance of 12–18%)
- Key Levels: Support at $12.94 (SMA50), Resistance at $13.47 (SMA200)
OVERALL BIAS
OVERALL BIAS: BULLISH - Higher lows off the October bottom, a bullish MACD position above zero, +DI above −DI, and a rising SMA50 under price tilt the odds toward a modest advance. Conviction is limited by weak ADX, a fading MACD histogram, and overhead resistance at the SMA200 and VWAP.
This is educational analysis and not financial advice.