AAL 27-day bearish forecast — Nov 15, 2026
- Bias: Bearish
- Timeframe: 27 days (made Nov 15, 2026, target date Dec 11, 2026)
- Price at analysis: $13.17
- Price target: $12.85
- Expected range: $12.20 – $14.30
- Result: Pending — graded after the close on Dec 11, 2026
Get a free AI analysis of AAL today
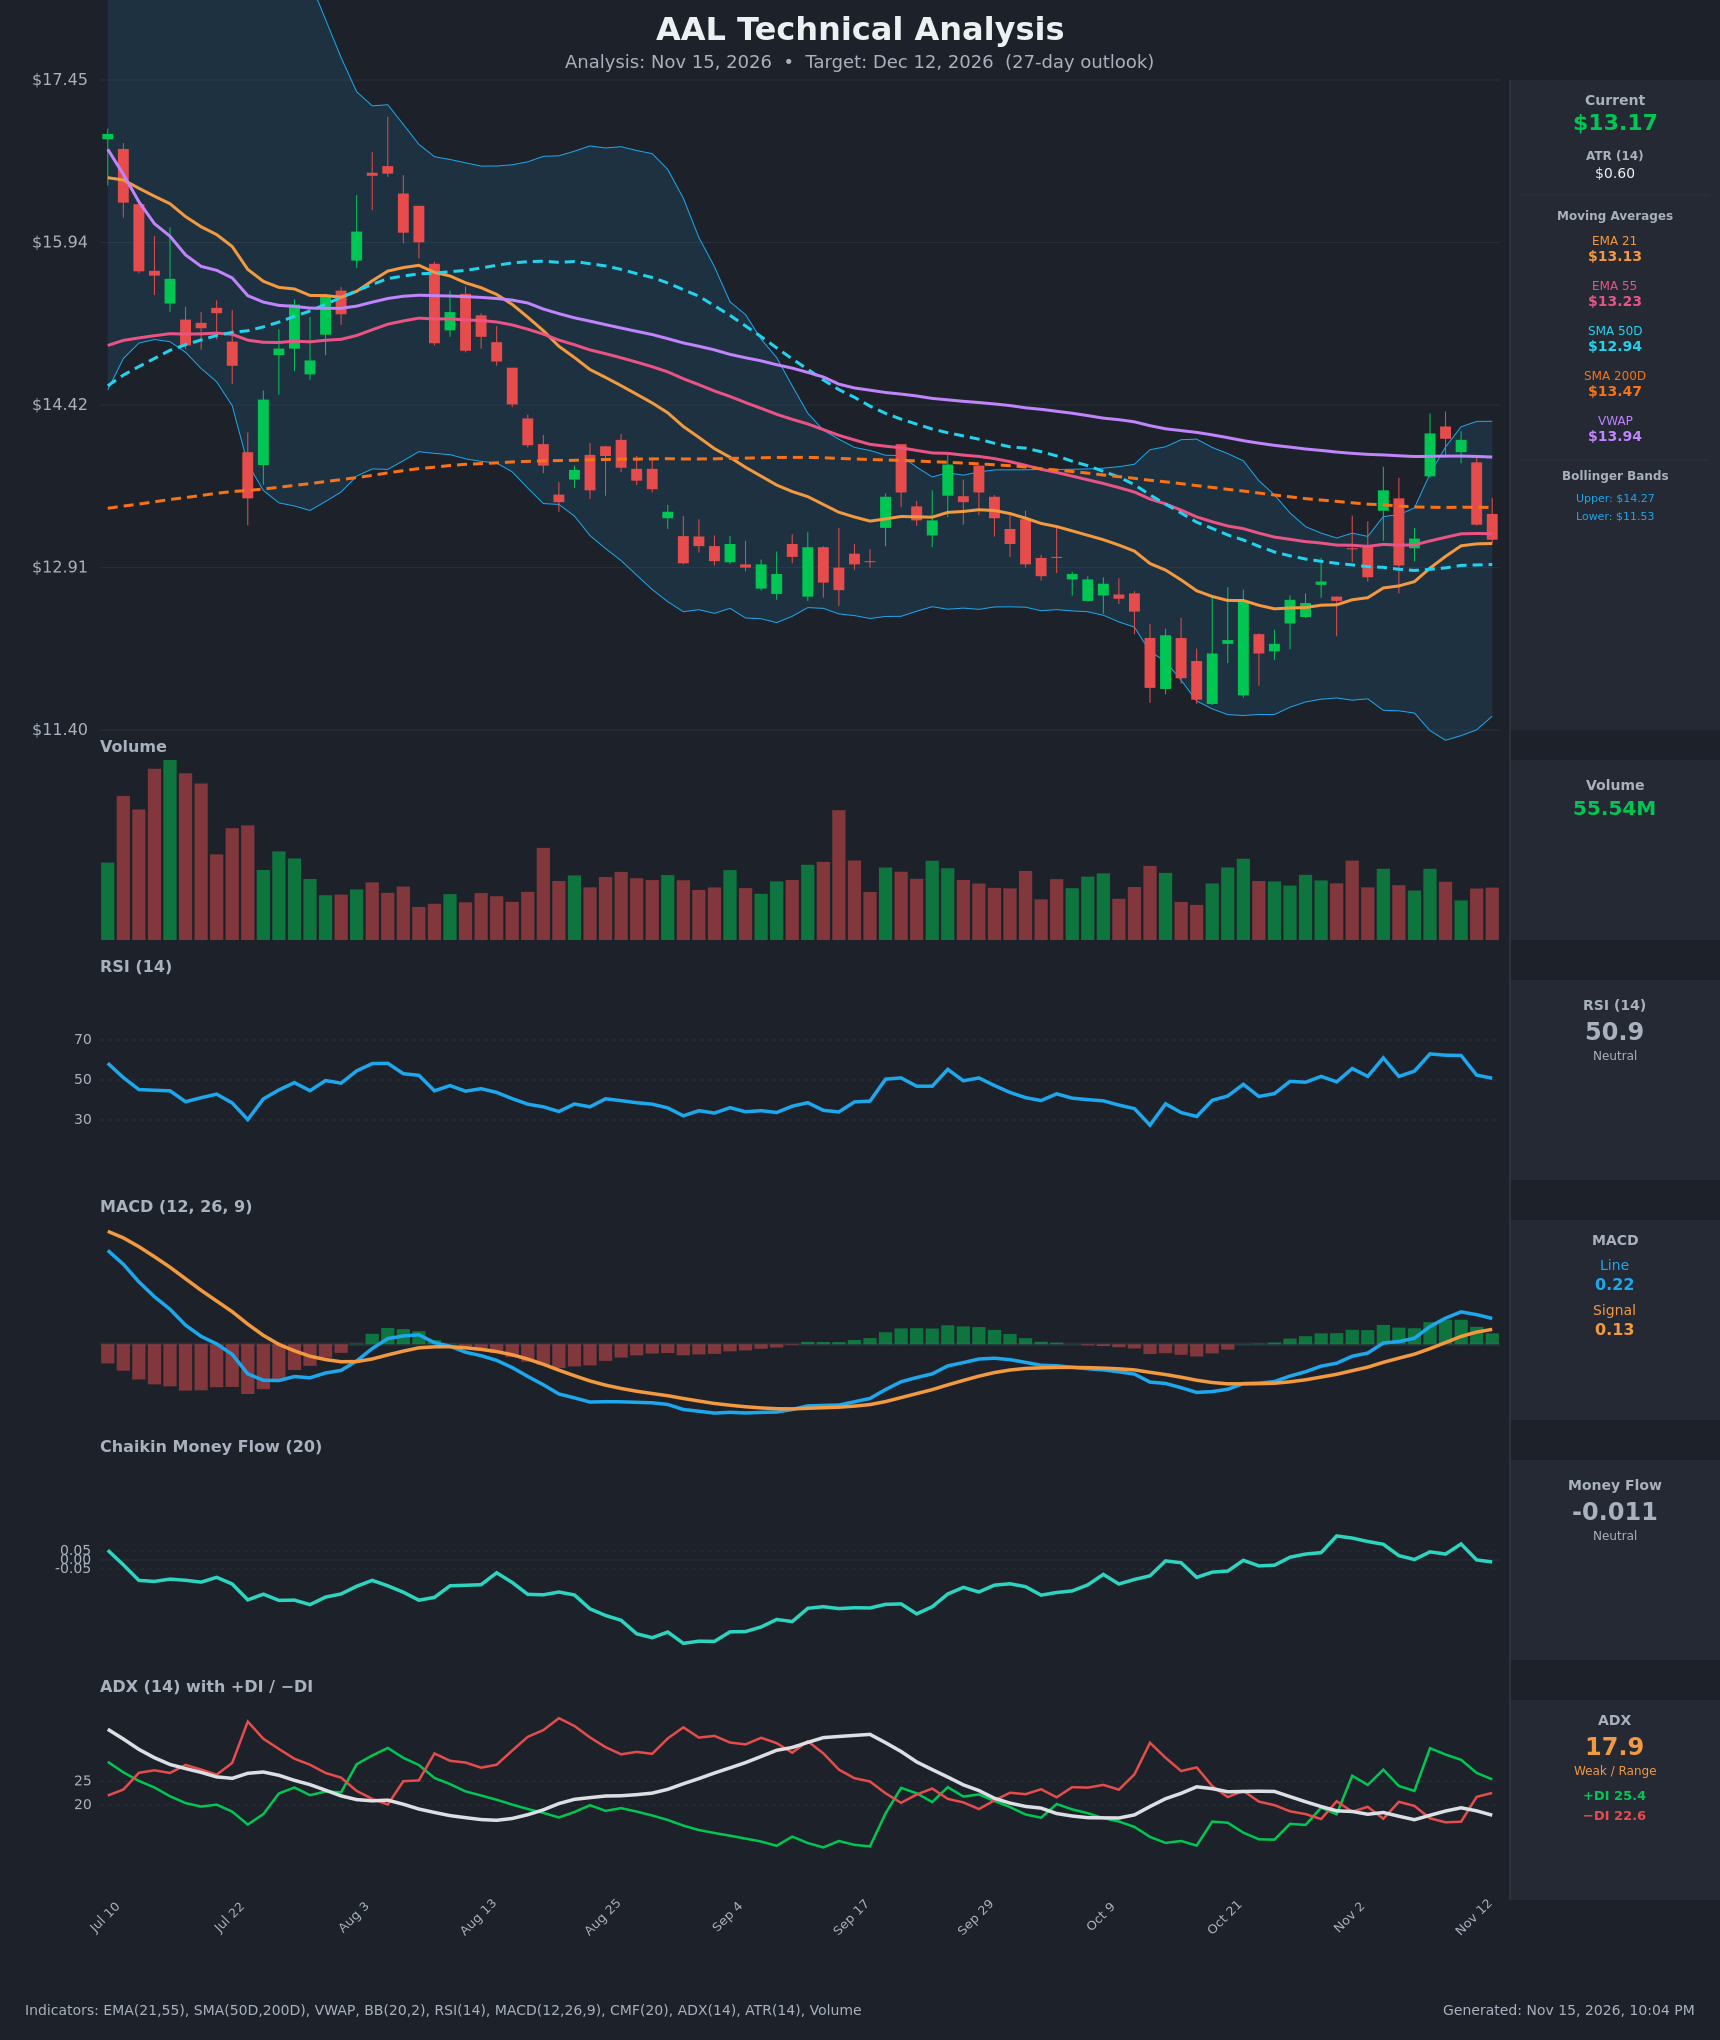
Analysis
TECHNICAL INDICATORS
- RSI (14): 50.89, dead neutral. It has faded from 62-63 on Nov 9-11 and from 61 on Nov 4, so upside momentum is cooling without reaching overbought or oversold. [Neutral]
- 20 EMA: The 21 EMA is $13.13 and price ($13.17) sits right on it, so it is acting as a pivot rather than clear support. The 21 EMA is still below the 55 EMA ($13.23) with no bullish cross yet. Price also sits below the 55 EMA, SMA200D ($13.47) and VWAP ($13.94), which are overhead resistance layers. It is above the SMA50D ($12.94). [Neutral]
- MACD: The line (0.223) is above the signal (0.129), so the histogram is positive at about +0.094. The line peaked at 0.280 on Nov 11 and the histogram has narrowed from about +0.21 to +0.09. The bullish crossover on Nov 10 is intact but losing steam. [Neutral]
- Bollinger Bands (20): The bands run $11.53 to $14.27, with the midline near $12.90. Price is slightly above the midline and well inside the bands. The Nov 9-11 push to $14.1 stalled just under the upper band and failed. The bands are widening after the Oct selloff. [Neutral]
- CMF (20): -0.011, inside the neutral band and just rolled over from +0.088 on Nov 11. It has been drifting between roughly 0 and +0.13 for two weeks, so accumulation has faded. [Neutral]
- ADX (14): 17.9 and falling, which means weak or range-bound conditions. +DI (25.4) is above −DI (22.6), but the gap has narrowed from about 15 points on Nov 9 to under 3 points. A bearish DI cross is a near-term risk. [Weak Trend, slight bullish lean fading]
- Volume: 55.54M, around average with no surge. The Nov 9 breakout toward $14.16 and the rejection since both came on unremarkable volume, so there is no strong conviction on either side. [Neutral, no confirmation]
DIVERGENCES & TRENDS
- Price made a higher low in October (about $11.6 to $11.7) and then rallied to $14.16. This is a classic early basing structure, but the higher-timeframe trend is still down from the $17+ July peak, with lower highs and lower lows.
- Momentum is fading. RSI, MACD line and ADX all peaked around Nov 9-11 while price has already given back about $1 from its high. This is mild short-term momentum deterioration rather than a true divergence.
- The SMA50D ($12.94) is below the SMA200D ($13.47) after the earlier death cross, and the gap is narrowing slowly. There is no golden cross imminent.
- The EMA21/EMA55 gap has nearly closed (13.13 vs 13.23). A bullish cross is possible but fragile, and price is oscillating around both.
- The long-term trend is bearish: price is below the SMA200D and VWAP. The medium-term trend is a recovery bounce, and the short-term trend is a stall.
CHART PATTERNS
- Bearish Flag / rising-range retracement (tentative): After the sharp Oct 21 to Nov 11 recovery, price is stalling under the SMA200D, VWAP and $14.1-14.3 supply. This resembles a consolidation inside a larger downtrend. A break below the SMA50D (about $12.94) would target about $12.2-12.5.
- Symmetrical Triangle / range: Price oscillates between roughly $12.6 and $14.2 with converging momentum and weak ADX. A break below $12.9 favors the bearish resolution, and a close above $13.5-13.9 favors the bullish one.
- Bullish Double Bottom (partial): The October lows around $11.6 could develop into a base. It is not confirmed unless price clears the $14.2-14.4 neckline area, so it is a lower-probability read for now.
POTENTIAL SCENARIOS
- Scenario 1: Bearish Rejection and Fade Back to Support — Price fails again at the SMA200D/EMA55 cluster ($13.23-$13.47) and VWAP, the MACD histogram turns negative and −DI crosses back above +DI. Trigger: daily close below the SMA50D at $12.94 and the Bollinger midline at about $12.90. Target: $12.20-$12.85. Invalidation: daily close above $13.60 on rising volume. (45% probability)
- Scenario 2: Bullish Breakout of the Recovery Range — Buyers reclaim the SMA200D and VWAP, the EMA21 crosses above the EMA55, and CMF turns positive above +0.05. Trigger: close above $13.50 and then above $14.20. Target: $14.20-$14.60. Invalidation: close back below $12.90. (35% probability)
- Scenario 3: Neutral Chop in the $12.60-$13.90 Range — Weak ADX keeps price oscillating around the EMA21 and the moving-average cluster with no resolution. Trigger: price holds $12.9-$13.5 with ADX staying below 20. Target: $13.00-$13.40. Invalidation: close outside $12.60-$13.90. (20% probability)
PRICE TARGETS
- Target Price: $12.85 (27-day outlook)
- Expected Range: $12.20 to $14.30 (width $2.10, about 15.9% of the current price, appropriate for roughly 27 days)
- Key Levels: Support at $12.94 (SMA50D, then the $12.90 Bollinger midline and $12.50 below), Resistance at $13.47 (SMA200D, then VWAP at $13.94 and the $14.16-$14.27 highs)
OVERALL BIAS
OVERALL BIAS: BEARISH - Price is stuck beneath the SMA200D, EMA55 and VWAP after a failed push toward $14.2, while MACD, RSI, CMF and the DI spread are all fading and ADX is weak. The larger trend is still down from July, so a drift back toward the SMA50D and $12.2-12.9 is somewhat more likely than a clean breakout.
This is educational analysis and not financial advice.