AAL 20-day bearish forecast — Nov 15, 2026
- Bias: Bearish
- Timeframe: 20 days (made Nov 15, 2026, target date Dec 4, 2026)
- Price at analysis: $13.17
- Price target: $12.85
- Expected range: $12.20 – $13.75
- Result: Pending — graded after the close on Dec 4, 2026
Get a free AI analysis of AAL today
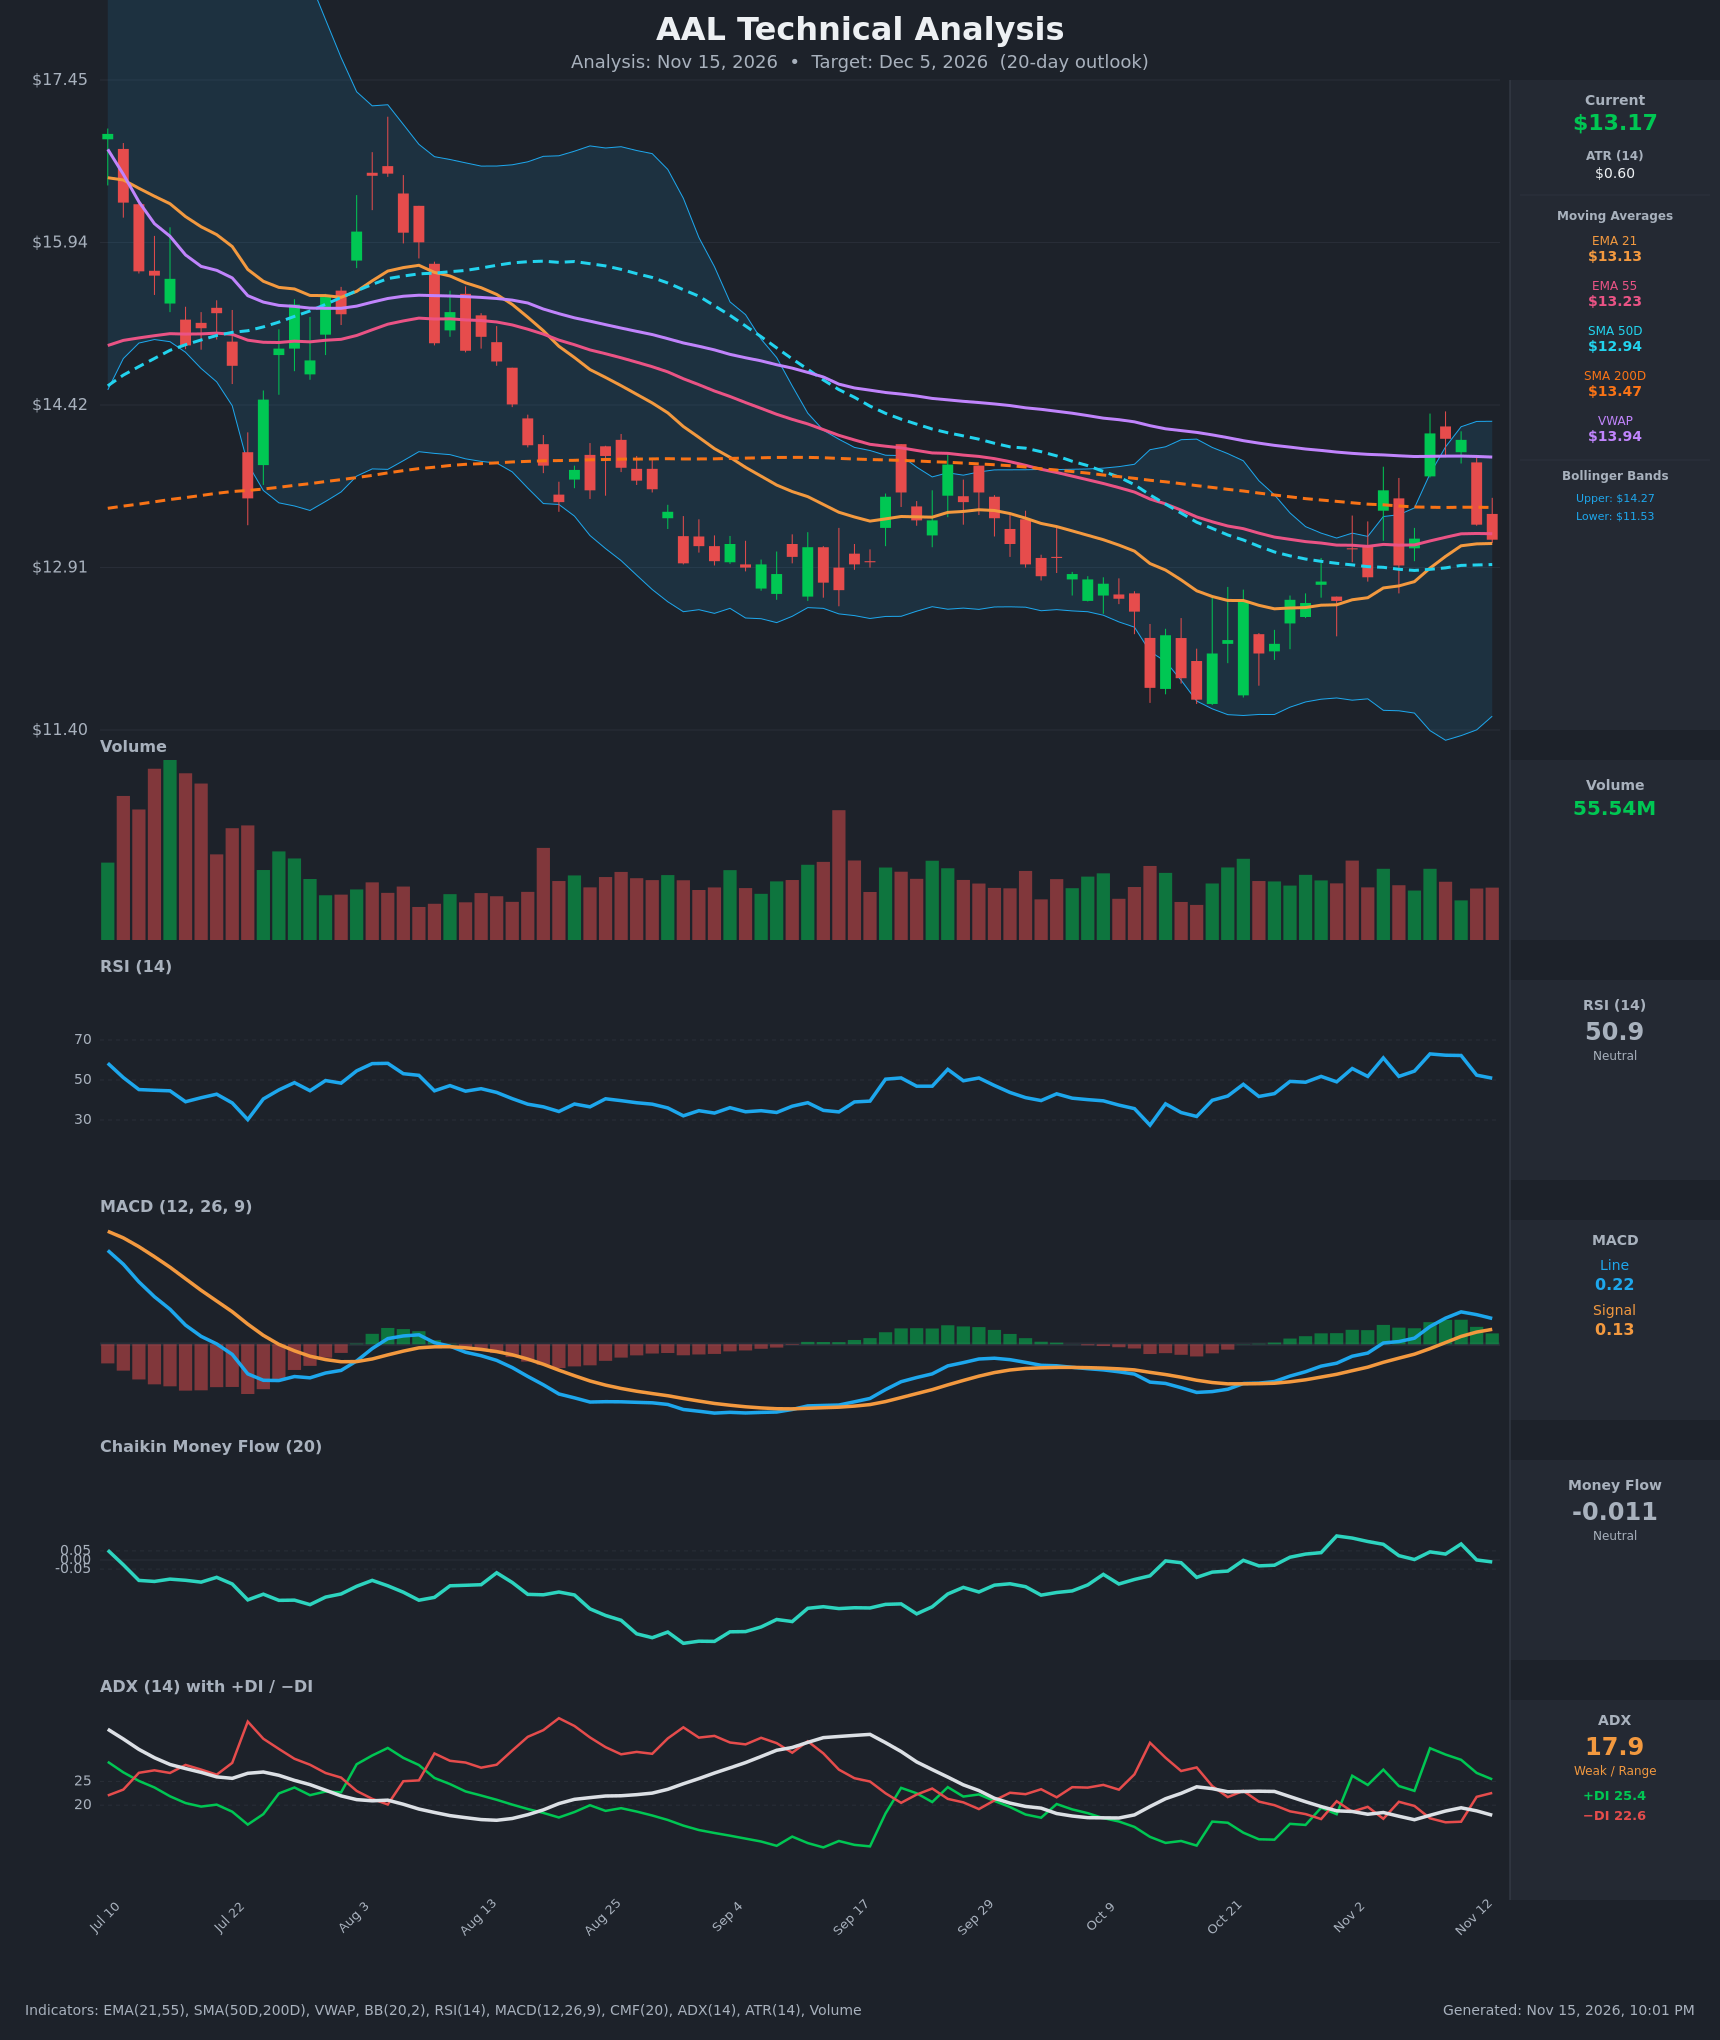
Analysis
TECHNICAL INDICATORS
- RSI (14): 50.89, down from 62-63 on Nov 9-11 and back at the midline. Momentum is fading after the spike, but there is no oversold or overbought extreme. [Neutral]
- 20 EMA: The EMA 21 is $13.13 and price ($13.17) is only just above it. EMA 21 is also still below EMA 55 ($13.23), so there is no bullish crossover yet. Price is sitting on the average rather than being supported by it. [Neutral]
- MACD: Line 0.223 is above signal 0.129, so it is still a bullish crossover from Nov 10 and above zero. However, the histogram has shrunk from about 0.21 (Nov 11) to 0.09 (Nov 13) and the line is rolling over, so momentum is decelerating. [Neutral]
- Bollinger Bands (20): Upper $14.27, lower $11.53, and the bands are wide. Price is near the middle band at $13.17. The Nov 9-11 run to $14.16 stalled below the upper band and faded, so the band offers no edge. [Neutral]
- CMF (20): -0.011, inside the ±0.05 neutral zone. It has slipped from the positive readings of early November and is flattening toward zero, which means buying pressure is not following through. [Neutral]
- ADX (14): 17.9 and falling, which means weak or range-bound conditions. +DI (25.4) is above −DI (22.6), but the gap has narrowed from about 15 points on Nov 9 to under 3, so the bullish control is eroding. [Weak Trend, slight bullish lean fading]
- Volume: 55.54M, around average. The Nov 9-11 rally did not come with a clear volume surge, and the last two sessions of selling were not light. There is no conviction either way. [Neutral]
Price sits below the SMA200D ($13.47) and VWAP ($13.94) but above the SMA50D ($12.94). The SMA50D is below the SMA200D, which is a death-cross configuration. The long-term trend is still down, and this is a bounce under overhead resistance.
DIVERGENCES & TRENDS
- Price vs. RSI/MACD: There is no classic divergence. Price made a lower close from $14.16 to $13.17 while the MACD histogram and RSI also fell, so momentum is confirming the pullback.
- Higher lows: Price has made higher lows since the October low near $11.5, and the SMA50D is turning up. That is the main constructive trend.
- Rejection cluster: The Nov 9 gap to $14.16 sat under VWAP ($13.94) and the SMA200D ($13.47) and was sold back down. Closing back below the SMA200D after that spike is a failed breakout.
- Convergence: +DI/−DI are converging, and CMF has gone from positive to flat. A −DI crossover above +DI would confirm a bearish shift.
- Moving averages: EMA 21 and EMA 55 are converging at $13.13-$13.23, so a decision is likely soon. The SMA50D at $12.94 is the first real trend support.
CHART PATTERNS
- Bullish Double Bottom (reversal): The October lows near $11.5-$11.8 resemble a loose double bottom, with a neckline around $14.2. The first test of that neckline (the $14.16 spike) was rejected. A close above $14.3 would validate the pattern, with a measured target of roughly $16.5-$17 (neckline plus the pattern's height). This is not confirmed.
- Range / failed breakout: In the short term, price is oscillating between roughly $12.60 and $14.20 with ADX below 20. The failed move above the SMA200D resembles a Bearish Double Top / Triple Top in miniature, and a break below $12.90 would target about $12.2-$12.4.
- Significance: The bullish double bottom needs a break above $14.3, while the near-term failure favors a pullback toward the SMA50D first.
POTENTIAL SCENARIOS
- Scenario 1: Bearish Pullback to the SMA50D / Range Low — The rejection at the SMA200D and VWAP leads to a fade as MACD momentum decays and −DI retakes control. Trigger: daily close below $12.94 (SMA50D) and a MACD bearish crossover. Target: $12.50-$12.85, with an extension to $12.20. Invalidation: daily close above $13.50 (SMA200D) with CMF above +0.05. (45% probability)
- Scenario 2: Bullish Reclaim of the SMA200D — Higher lows hold, and price pushes through the $13.47 SMA200D and toward VWAP. Trigger: close above $13.50 on rising volume with the MACD histogram turning up. Target: $13.95-$14.25 (VWAP and upper band). Invalidation: close below $12.90. (35% probability)
- Scenario 3: Neutral Chop Around the EMAs — Weak ADX keeps price pinned between $12.80 and $13.50. Trigger: no daily close beyond either level. Target: $13.00-$13.30. Invalidation: close outside $12.80-$13.50. (20% probability)
PRICE TARGETS
For the 20-day horizon (to Dec 5, 2026):
- Target Price: $12.85
- Expected Range: $12.20 to $13.75 (width $1.55, about 11.8% of current price, consistent with the 14-21 day guidance)
- Key Levels: Support at $12.94 (SMA50D), Resistance at $13.47 (SMA200D)
OVERALL BIAS
OVERALL BIAS: BEARISH - Price was rejected at the SMA200D/VWAP resistance cluster and the MACD histogram and RSI are rolling over. +DI and −DI are converging with a weak ADX and neutral CMF, so a drift back toward the $12.94 SMA50D and the $12.2-$12.9 zone is the slightly more likely outcome. Conviction is modest because the higher lows and positive MACD still leave room for a reclaim of $13.47.
This is educational analysis and not financial advice.