AAL 62-day bullish forecast — Nov 15, 2026
- Bias: Bullish
- Timeframe: 62 days (made Nov 15, 2026, target date Jan 15, 2027)
- Price at analysis: $13.17
- Price target: $13.70
- Expected range: $12.00 – $15.20
- Result: Pending — graded after the close on Jan 15, 2027
Get a free AI analysis of AAL today
Analysis
TECHNICAL INDICATORS
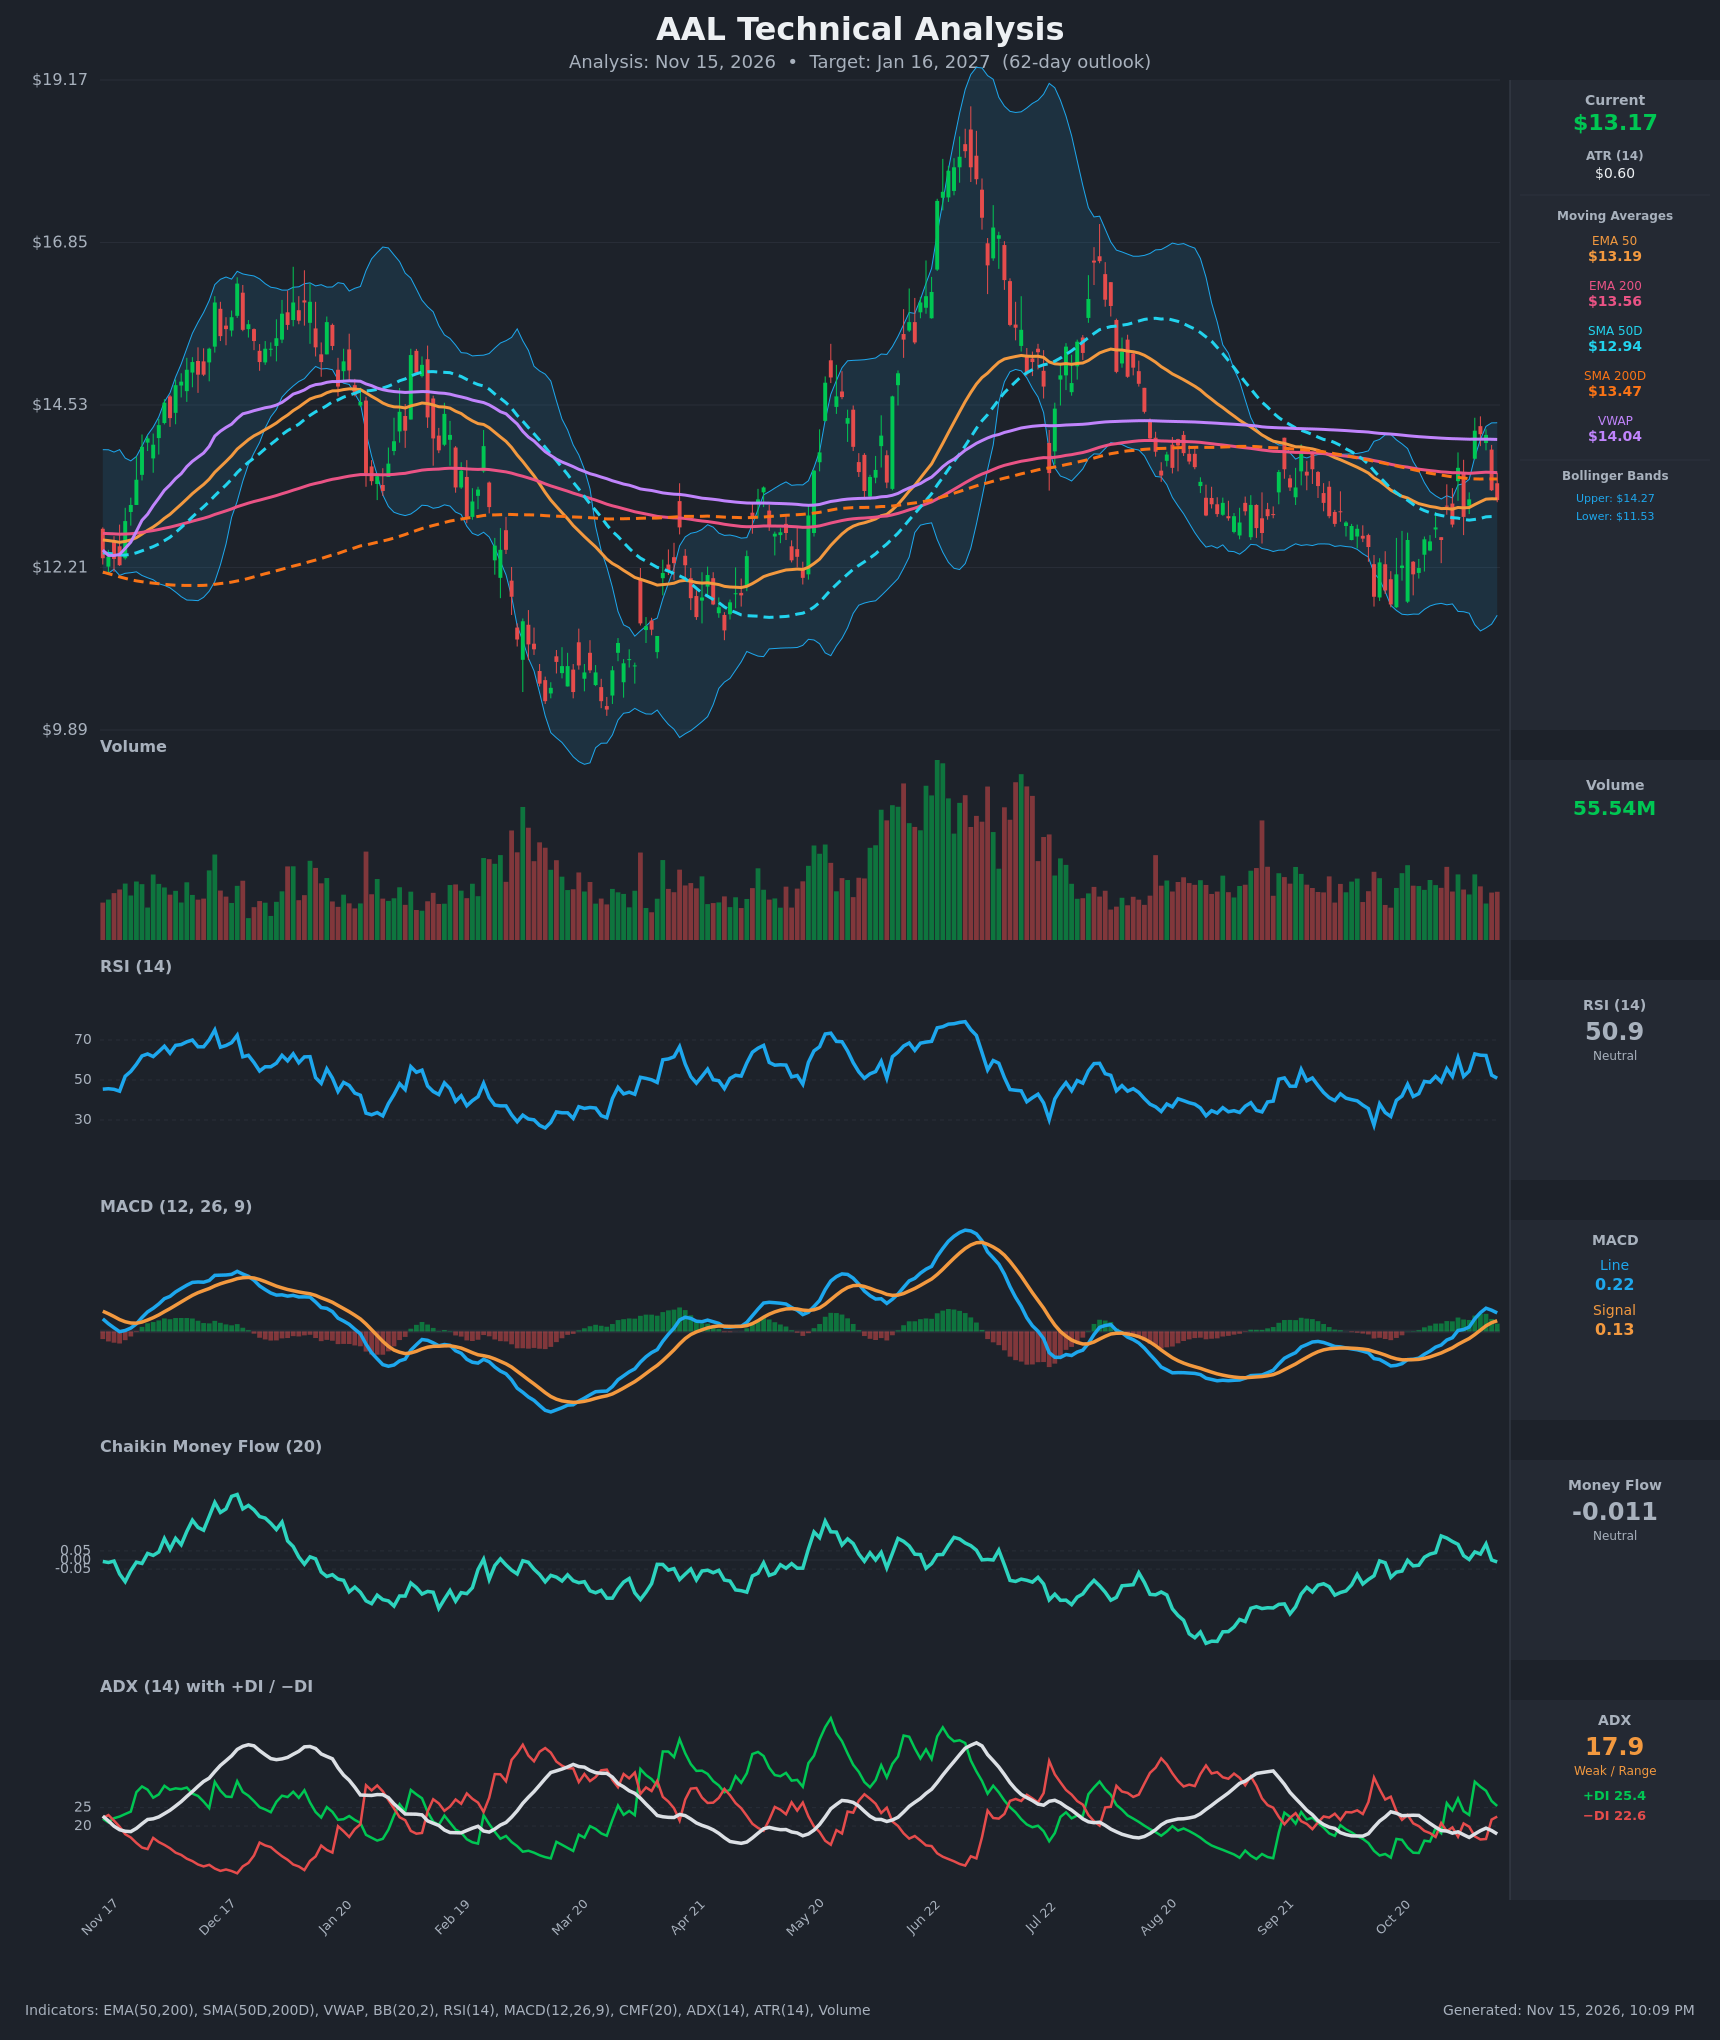
- RSI (14): 50.89, right at the midline. It has dropped from 62-63 on Nov 9-11 and stepped down through 52 to 51. There is no overbought or oversold condition, and short-term momentum is fading. [Neutral]
- 20 EMA / Moving Averages: No 20 EMA was provided, so I use the EMA 50 ($13.19) as the short-term proxy. Price ($13.17) sits just under it, which makes it a pivot. Price is below the EMA 200 ($13.56), SMA 200D ($13.47) and VWAP ($14.04), all of which act as overhead resistance. It is above the SMA 50D ($12.94), which is nearby support. The SMA 50D is below the SMA 200D, so the death-cross state persists, but the gap is narrowing (about $0.53). [Neutral]
- MACD: Line 0.223 is above signal 0.129, after a bullish crossover on Nov 10 and a move above zero on Nov 4. The line peaked at 0.280 on Nov 11 and has rolled over (0.256, then 0.223), so the histogram is shrinking. The trend is bullish, but momentum is cooling. [Bullish]
- Bollinger Bands (20): Upper $14.27, lower $11.53, middle about $12.90. Price is slightly above the midline and well inside the bands. The bands are wide, which reflects the volatile swings. The Nov 9-11 push reached the upper band area and was rejected. [Neutral]
- CMF (20): -0.011, inside the ±0.05 neutral zone. It has faded from +0.088 on Nov 11 to zero and then slightly negative, so buying pressure has not persisted. [Neutral]
- ADX (14): 17.9, below 20, so the trend is weak or range-bound. +DI (25.4) is above −DI (22.6), a slight bullish tilt, but the gap has narrowed from 32 vs 17 on Nov 9. [Weak Trend, slight bullish tilt]
- Volume: 55.54M, about average. The volume bars show no capitulation or breakout surge, and recent up and down days are balanced. The Nov 9 breakout day was not followed through. [Neutral, no conviction]
DIVERGENCES & TRENDS
- There is no clear classic divergence. Price made a lower close ($13.17) after its Nov 9-11 highs ($14.1-14.2), and RSI and MACD also made lower readings, so they confirm the pullback rather than diverge.
- MACD is above its signal line and positive, but the histogram is contracting. This warns that the bounce is consolidating.
- The DI spread is narrowing, and ADX is stuck below 20, so there is no trend to follow yet.
- The multi-month price structure shows higher lows: about $11.7 in October, then $12.2, then $12.6. That suggests a base is forming.
- Price is stuck in a cluster of averages between $12.94 and $13.56. A decisive break of this cluster will set the direction.
- The SMA 50D is flattening and curling up toward the SMA 200D. A golden cross is possible within the window but not yet confirmed.
CHART PATTERNS
- Range with an Ascending Triangle tilt: There is flat resistance near $14.1-14.3 and rising lows from $11.7 to $12.2 to $12.6. A close above $14.3 would project a measured move of about $1.5-2.0, to roughly $15.5-16.
- Minor Triple Top (bearish counter-pattern): Closes of $14.16, $14.11 and $14.10 formed a tight cluster, followed by a sharp drop to $13.17. A break below $12.94 and then $12.20 would validate it, with a target near $12.0 or lower.
- Converging moving averages: The EMA 50, EMA 200 and SMA 200D are all within about $0.40 of price. This compression usually precedes an expansion in volatility.
- Overall, the structure leans mildly constructive but is unconfirmed.
POTENTIAL SCENARIOS
- Scenario 1: Bullish Range Break and Reclaim of the 200-Day Averages — Price reclaims the EMA 200 and SMA 200D, MACD stays positive, and the SMA 50D approaches a golden cross. Trigger: daily close above $13.56, then above VWAP at $14.04. Target: $14.30-$15.20 (the upper Bollinger Band and the Nov high retest). Invalidation: daily close below $12.90. (45% probability)
- Scenario 2: Neutral Range-Bound Chop — With ADX below 20 and CMF flat, price oscillates around the average cluster. Trigger: repeated failures at $13.60-$14.20 with support holding at $12.60-$12.94. Target: $12.70-$13.70. Invalidation: close above $14.30 or below $12.50. (25% probability)
- Scenario 3: Bearish Rejection and Retest of Lows — The triple-top-style rejection and the overhead averages cap price, and MACD rolls below signal. Trigger: daily close below $12.94 (SMA 50D) with −DI crossing above +DI. Target: $12.20, then $11.50 (the lower Bollinger Band). Invalidation: close above $13.60. (30% probability)
PRICE TARGETS
Timeframe: 62 days (Jan 16, 2027). Check on the range: the width is $15.20 − $12.00 = $3.20, which is 24.3% of $13.17. That sits within the 18-30% guidance for 61-180 days.
- Target Price: $13.70
- Expected Range: $12.00 to $15.20
- Key Levels: Support at $12.94, Resistance at $13.47
OVERALL BIAS
OVERALL BIAS: BULLISH - MACD is above its signal line and positive, +DI leads −DI, the lows are rising, and price is sitting at the EMA 50. The pull of the $13.47-$13.56 average cluster favors a modest upside drift. Conviction is modest, because ADX is weak, price is below the 200-day averages and VWAP, and CMF is flat.
This is educational analysis and not financial advice.