AAL 83-day bullish forecast — Nov 15, 2026
- Bias: Bullish
- Timeframe: 83 days (made Nov 15, 2026, target date Feb 5, 2027)
- Price at analysis: $13.17
- Price target: $13.80
- Expected range: $11.80 – $15.20
- Result: Pending — graded after the close on Feb 5, 2027
Get a free AI analysis of AAL today
Analysis
TECHNICAL INDICATORS
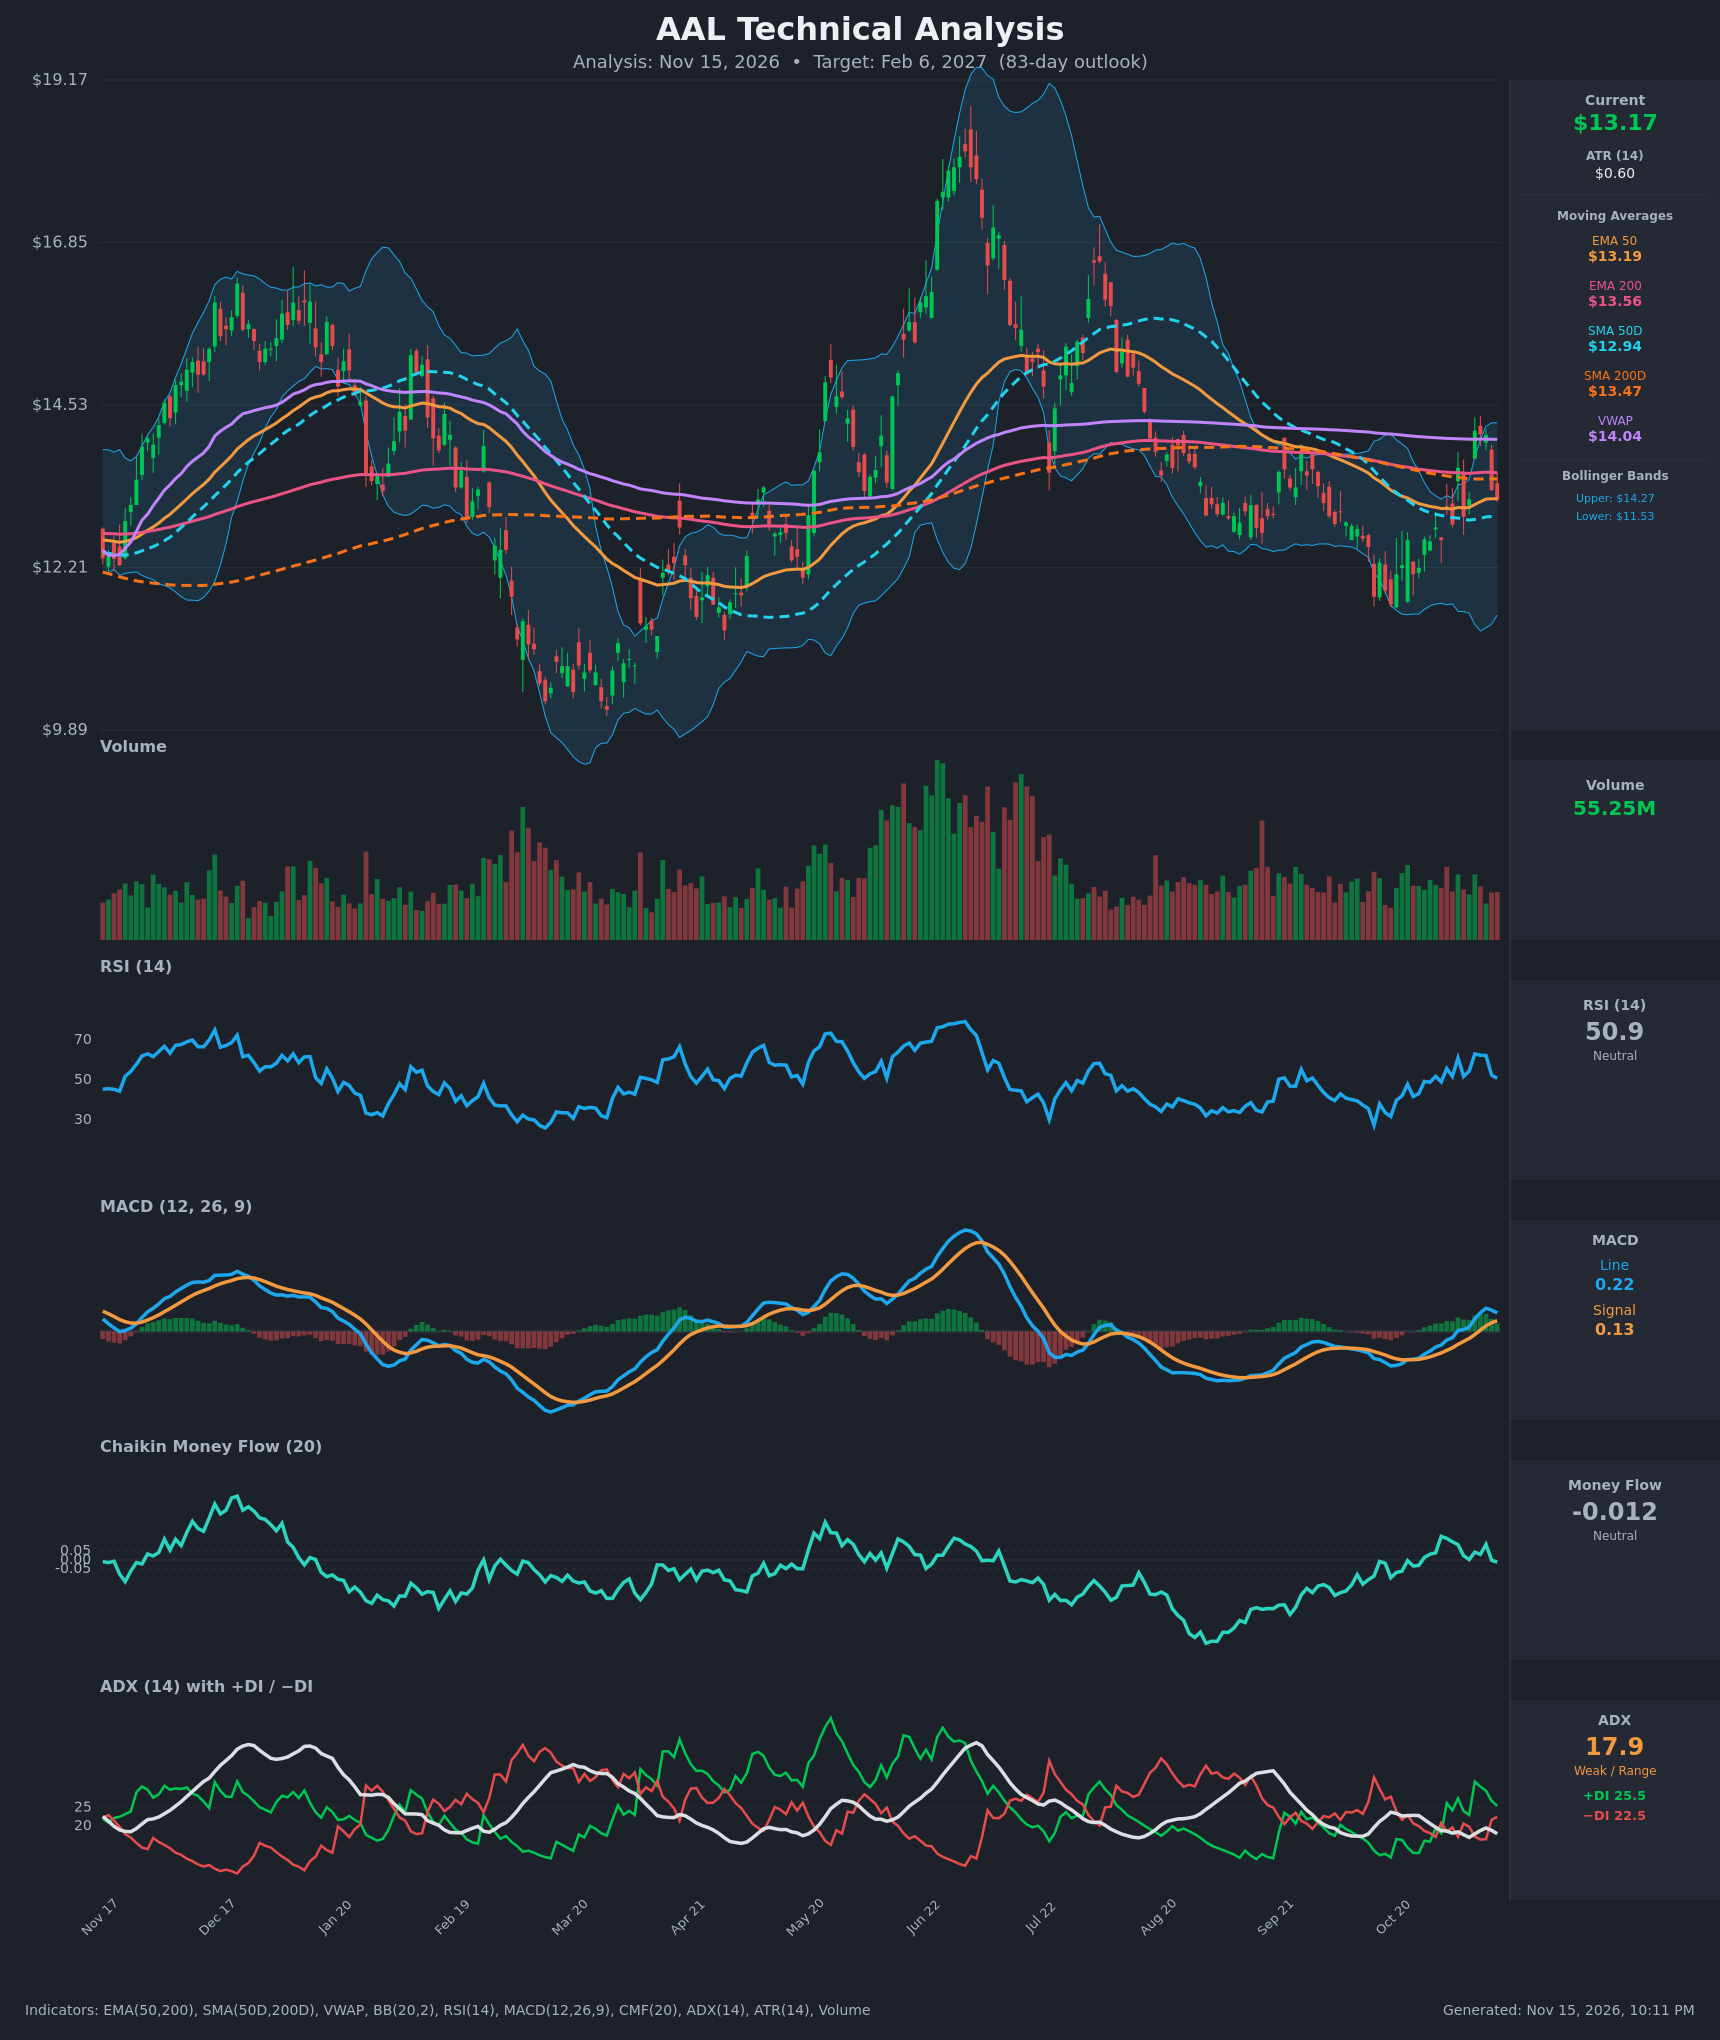
- RSI (14): 50.89, right at the midline. It has pulled back from the 62-63 area on Nov 9-11 but is well above the October trough in the low 30s. Momentum is stalling after a bounce, with no overbought or oversold signal. [Neutral]
- 20 EMA: No 20 EMA value was provided, so I use the EMA 50 as the nearest proxy. It sits at $13.19 and price at $13.17 is pinned to it. Price is below the EMA 200 ($13.56) and the VWAP ($14.04), which are overhead resistance, and above the SMA 50 ($12.94), which is nearby support. [Neutral]
- MACD: Line 0.223 is above signal 0.129, so it is positive and bullish. It crossed up on Nov 4 and then crossed the signal at about +0.015 on Nov 10. The histogram (about +0.094) has shrunk from roughly +0.21 on Nov 11, and the line peaked at 0.280, so momentum is fading. [Bullish]
- Bollinger Bands (20): Upper $14.27, lower $11.53, midline about $12.90. Price is in the upper-middle of the bands after rejecting near $14.16. The bands are moderately wide, with no squeeze and no band-walk. [Neutral]
- CMF (20): -0.012, inside the ±0.05 neutral band. It has drifted from +0.13 (Oct 30) to roughly zero, which shows buying pressure has faded without turning into distribution. [Neutral]
- ADX (14): 17.9 and drifting lower, below 20, so the market is weak or range-bound. +DI (25.5) is above −DI (22.5), but the gap narrowed from the Nov 9 spread of 32 vs 17. Bulls hold a slight edge without trend strength. [Weak Trend, slight bullish lean]
- Volume: 55.25M, about average with no expansion on the recent rally or the pullback. The Nov 9 breakout to $14.16 was not followed by strong volume, so conviction is limited. [Neutral]
DIVERGENCES & TRENDS
- MACD: The histogram is rolling over while price sits flat, a mild early warning of momentum loss. There is no clear price/RSI divergence.
- Moving averages: EMA50 ($13.19) is below EMA200 ($13.56) and SMA50 ($12.94) is below SMA200 ($13.47). Both are bearish long-term configurations, but the gaps are very small and the 50-period lines are turning up.
- Long-term averages: Price is below the 200-day averages and the VWAP, so the long-term trend is not yet bullish. Price has reclaimed the SMA 50, which is rising.
- Higher low: The October low (about $11.7) is above the spring low (about $9.9). The Nov bounce to $14.16 was a higher swing than anything since August.
- Crossovers: The MACD bullish crossover is intact. +DI is above −DI after the Nov 2 and Nov 9 crossovers, though it narrowed on Nov 12-13. There is no golden cross, and the death-cross gap is narrowing.
CHART PATTERNS
- Symmetrical triangle (continuation/undecided): Over the past year the highs have stepped down ($19 → $16.8 → $15.2 → $14.2) while the lows have stepped up ($9.9 → $11.7). Volatility is contracting toward an apex and a breakout is likely within the 83-day window. A break above about $14.2 targets $15.2-$15.5, and a break below $12.5 targets $11.5.
- Consolidation range: Since August, price has traded between about $11.7 and $14.3. The $12.5-$14.2 area is the current core range.
- Failed double-top risk: A retest of the $14.1-$14.2 highs that fails would resemble a bearish double top, with the neckline near $12.5.
POTENTIAL SCENARIOS
- Scenario 1: Bullish Breakout From Triangle — Higher lows, the positive MACD and +DI above −DI let price reclaim the EMA 200 and VWAP cluster at $13.56-$14.04 and then break the November high. Trigger: daily close above $14.16 with volume expansion. Target: $15.20-$15.50. Invalidation: close below $12.50. (45% probability)
- Scenario 2: Neutral Range Chop — ADX stays below 20 and price oscillates between the SMA 50 and the VWAP/upper band. Trigger: repeated rejections at $14.0-$14.2 and bounces at $12.5-$12.9. Target: $12.70-$13.70. Invalidation: close outside the $12.50-$14.20 range. (30% probability)
- Scenario 3: Bearish Rejection — The fading MACD histogram and the overhead EMA200/SMA200/VWAP lead to a lower high and a break of support. Trigger: daily close below $12.50 (and the SMA 50 at $12.94). Target: $11.50-$11.80, the lower Bollinger Band and the October low. Invalidation: close above $14.20. (25% probability)
PRICE TARGETS
- Target Price: $13.80 (83-day horizon, about +4.8%)
- Expected Range: $11.80 to $15.20 (width $3.40, about 25.8% of current price, consistent with the 61-180 day guidance)
- Key Levels: Support at $12.94 (SMA 50, with deeper support at $12.50 and $11.53), Resistance at $14.16 (November high, with intermediate resistance at $13.56 EMA 200 and $14.04 VWAP)
OVERALL BIAS
OVERALL BIAS: BULLISH - Higher lows, a positive MACD with the line above its signal, and +DI above −DI favor an upside resolution of the contracting triangle. The edge is modest because ADX is weak, price is below the 200-day averages and VWAP, and the MACD histogram is fading.
This is educational analysis and not financial advice.