AAL 48-day bullish forecast — Nov 15, 2026
- Bias: Bullish
- Timeframe: 48 days (made Nov 15, 2026, target date Jan 1, 2027)
- Price at analysis: $13.17
- Price target: $13.70
- Expected range: $12.20 – $14.40
- Result: Pending — graded after the close on Jan 1, 2027
Get a free AI analysis of AAL today
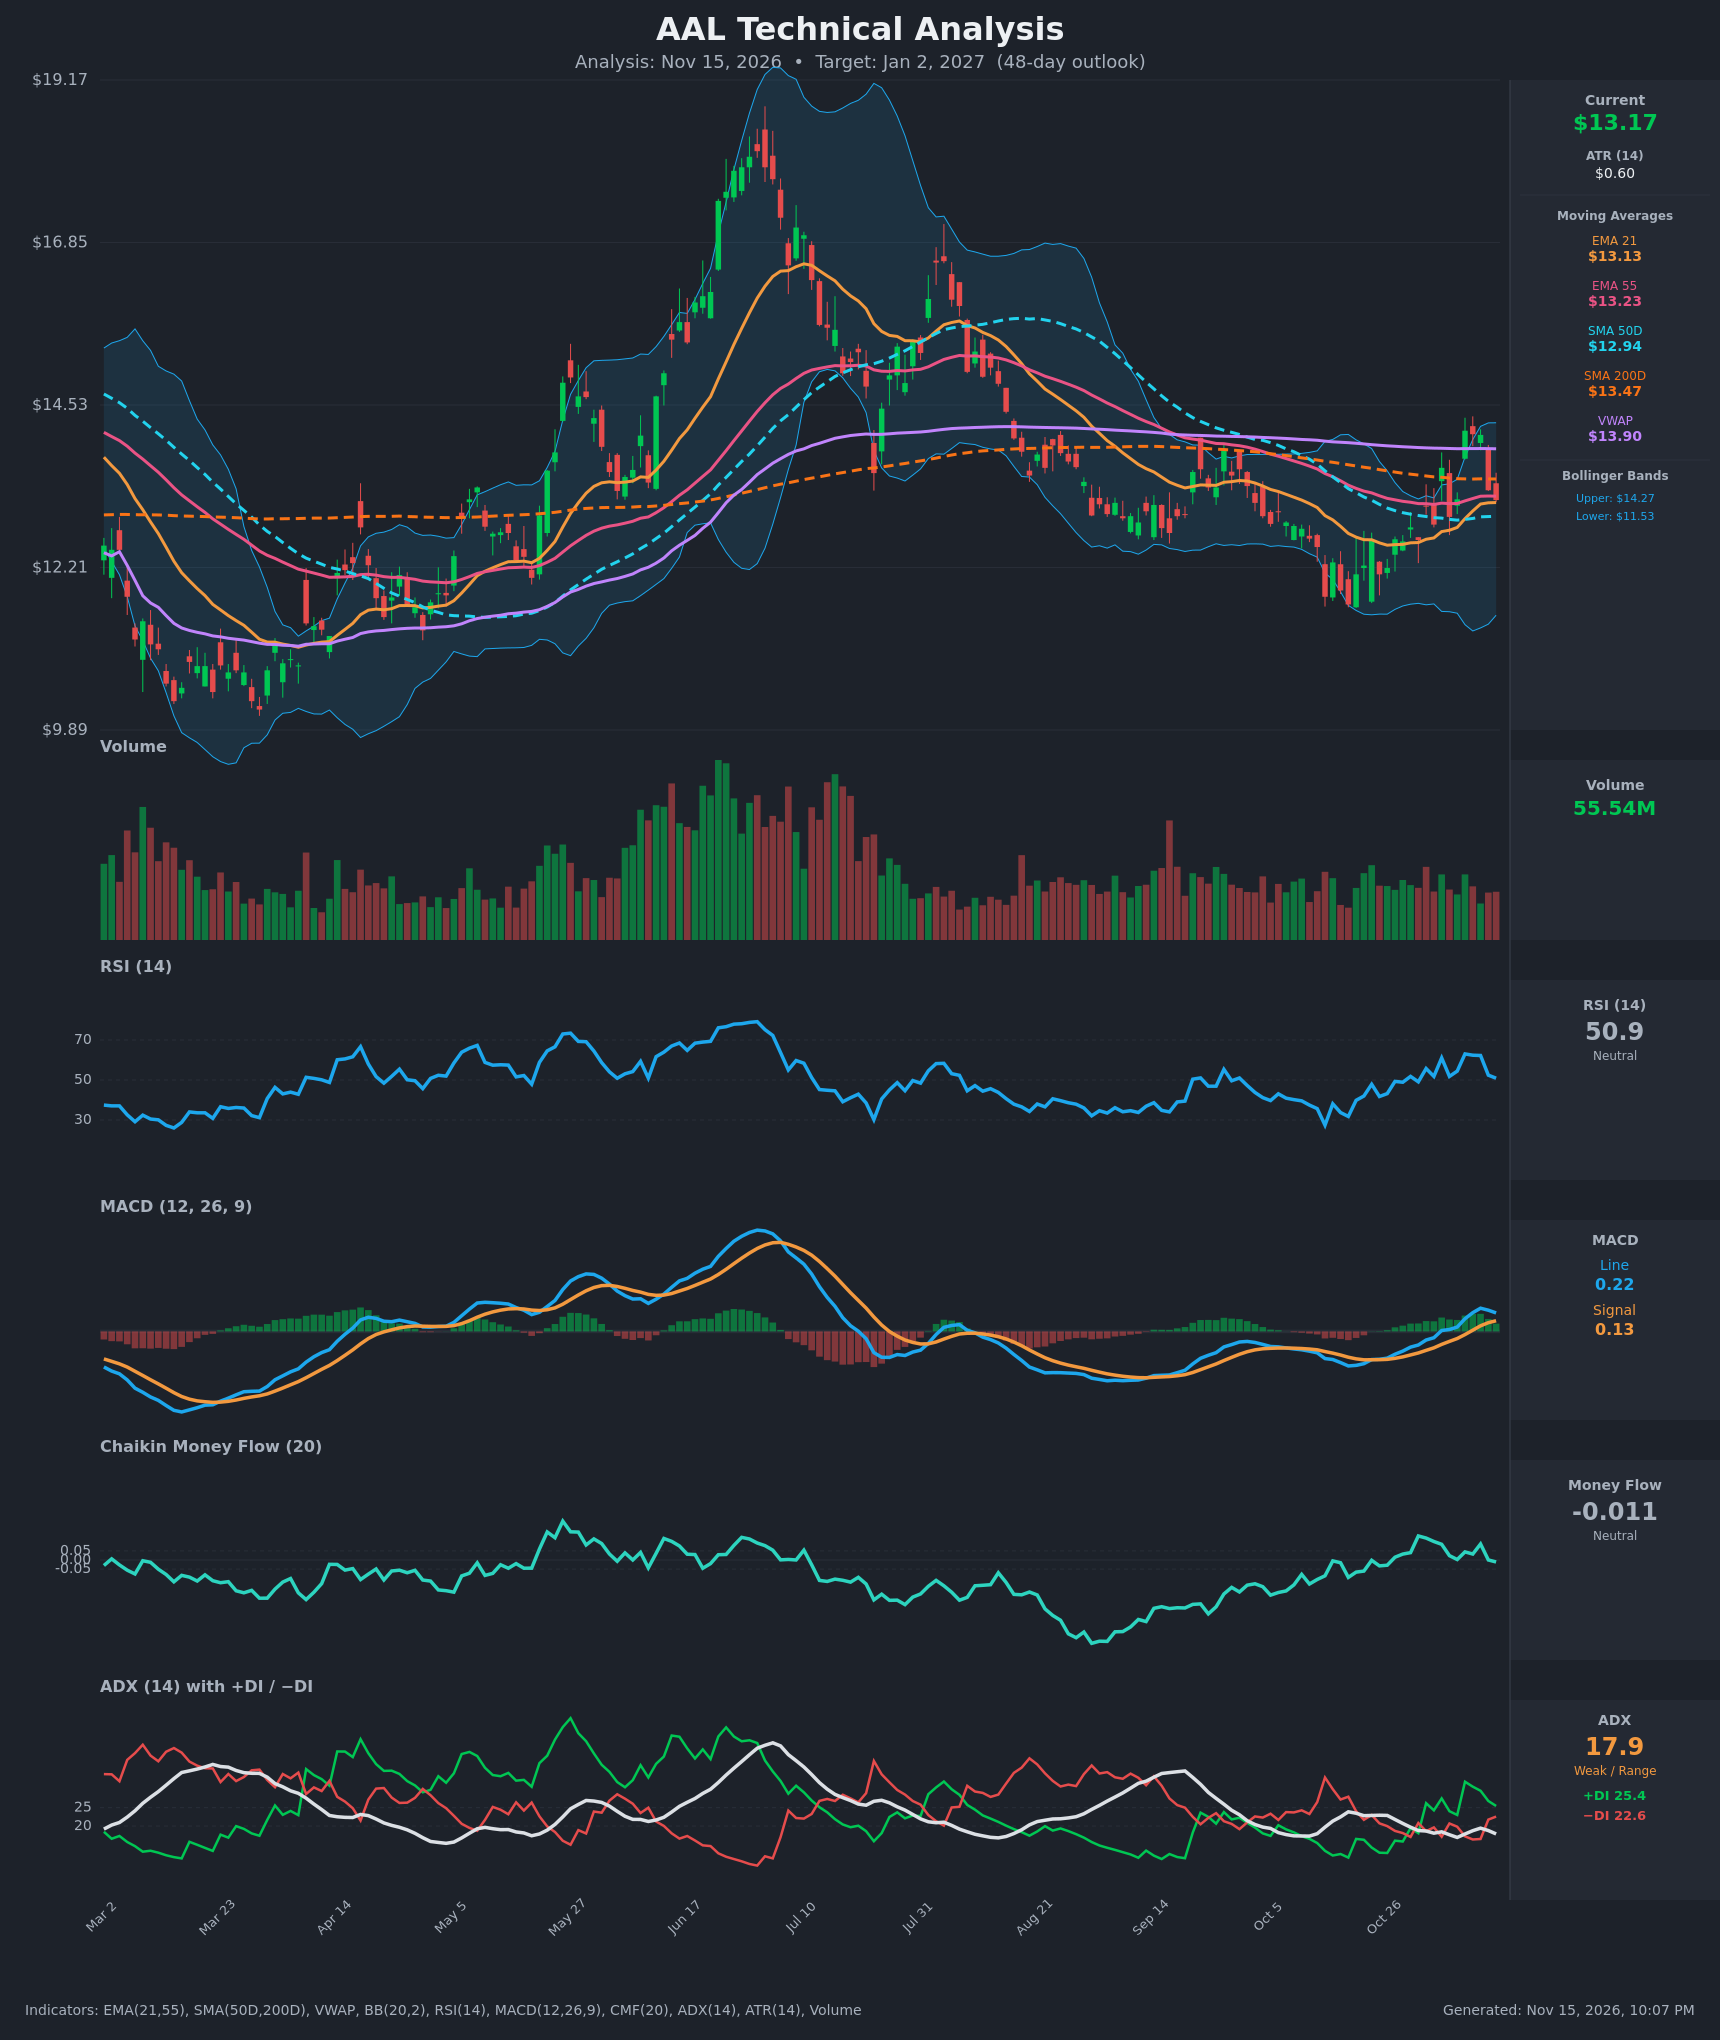
Analysis
TECHNICAL INDICATORS
- RSI (14): 50.89, right at the midline. It has pulled back from 63 on Nov 9 and is rolling over, but it has not weakened enough to signal a downtrend. [Neutral]
- 20 EMA (EMA 21): $13.13, with price ($13.17) sitting right on it. The EMA turned up from $12.53 in late October, so short-term support is intact but being tested. The EMA 21 is still below the EMA 55 ($13.23), so no bullish cross yet. [Neutral]
- MACD: Line 0.223 is above signal 0.129 and positive, after a bullish crossover on Nov 4-10. The line peaked at 0.280 on Nov 11 and is now declining, so the histogram is shrinking and momentum is fading. [Bullish] (weakening)
- Bollinger Bands (20): Upper $14.27, lower $11.53, middle about $12.90. Price is in the upper half of the bands. The rally was rejected near the upper band ($14.1-14.2). Bandwidth is moderate, so there is no squeeze. [Neutral]
- CMF (20): -0.011, inside the ±0.05 neutral zone. It has faded from +0.088 on Nov 11, so there is no accumulation or distribution edge. [Neutral]
- ADX (14): 17.9 and drifting lower, which indicates a weak or range-bound trend. +DI (25.4) is above −DI (22.6), a slight bullish tilt, but the gap is narrowing after Nov 12. [Weak Trend, slight bullish bias]
- Volume: 55.54M, average to slightly below average. The rally to $14.16 did not come with a strong volume surge, and recent volume has been steady and unremarkable. There is no conviction either way. [Neutral]
Moving average structure:
- Price is above the SMA50 ($12.94), which is rising slightly.
- Price is below the SMA200 ($13.47) and below VWAP ($13.90), both overhead resistance.
- The SMA50 is below the SMA200, so there is no golden cross. The gap is narrow, about $0.53.
DIVERGENCES & TRENDS
- There is no major divergence. The MACD line peaked on Nov 11 while price fell from $14.10 to $13.17, so momentum is cooling modestly.
- RSI fell from 62 to 51 in three sessions, a sharp give-back. This is a pullback inside a recovery, not a breakdown.
- Price made higher lows: the late-Oct low was about $11.6-12.2, and the current pullback holds well above it. The Nov 9 gap-up to $14.16 was retraced by about 75%.
- The EMA 21 is converging on the EMA 55 and the SMA200 at about $13.1-13.5. This is a congestion zone where price is likely to chop before choosing a direction.
- The MACD bullish crossover is intact, and +DI is still above −DI.
CHART PATTERNS
- The closest match is a Bullish Flag / Pennant after the sharp Nov 9 advance. The pullback has been orderly and is holding the EMA 21 and SMA50. A break above about $14.2 would project to roughly $15.0-15.5.
- The longer chart shows a base after the June-July peak decline: a series of higher lows from about $11.6, with price compressing between $11.7 and $14.2. This resembles a Symmetrical Triangle or range, which is neutral until it breaks.
- The failure at the $14.1-14.3 resistance (upper band, VWAP, prior June-August highs) creates a possible Double Top risk. It is confirmed only below about $12.9-13.0, where the SMA50 and the Nov 6 closing area sit.
POTENTIAL SCENARIOS
- Scenario 1: Bullish Flag Breakout / Recovery Continuation — Price holds the EMA 21 and SMA50, reclaims the SMA200, and pushes toward VWAP and the upper band. Trigger: daily close above $13.50 (SMA200) with MACD holding positive, then a break above $14.20. Target: $14.00-14.40, with an extension to about $15.00 if volume expands. Invalidation: daily close below $12.90 (SMA50). (45% probability)
- Scenario 2: Bearish Rejection at Resistance — The failed push toward $14.2 and the position below the SMA200 and VWAP lead to a rollover and a retest of the lower range. Trigger: close below $12.90 and the MACD line crossing back below signal. Target: $12.20, then $11.60-11.70 (lower band area). Invalidation: close above $14.30. (30% probability)
- Scenario 3: Neutral Range Chop — ADX stays below 20 and price oscillates between about $12.50 and $14.00 around the converged moving averages. Trigger: failure to close above $14.20 or below $12.80. Target: $13.00-13.50. Invalidation: a decisive close outside $12.50-$14.20. (25% probability)
PRICE TARGETS
For the 48-day timeframe (Jan 2, 2027):
- Target Price: $13.70
- Expected Range: $12.20 to $14.40 (width $2.20, about 16.7% of the current price, consistent with 30-60 day guidance)
- Key Levels: Support at $12.94 (SMA50), Resistance at $13.47 (SMA200). Further resistance sits at $13.90 (VWAP) and $14.27 (upper Bollinger Band). Deeper support is at $12.20.
OVERALL BIAS
OVERALL BIAS: BULLISH - The MACD is positive after a bullish crossover, price holds above the rising SMA50 and the EMA 21, and +DI leads −DI. The structure of higher lows after the Nov 9 breakout also supports an upside bias, though conviction is modest because of weak ADX, neutral CMF, and overhead resistance at the SMA200 and VWAP.
This is educational analysis and not financial advice.