AMZN 6-day bearish forecast — Nov 1, 2026
- Bias: Bearish
- Timeframe: 6 days (made Nov 1, 2026, target date Nov 6, 2026)
- Price at analysis: $240.47
- Price target: $238.00
- Expected range: $231.50 – $245.00
- Result: Incorrect (+8.1%) — closed at $259.99 on Nov 6, 2026; quality score 0/100
Get a free AI analysis of AMZN today
Analysis
TECHNICAL INDICATORS
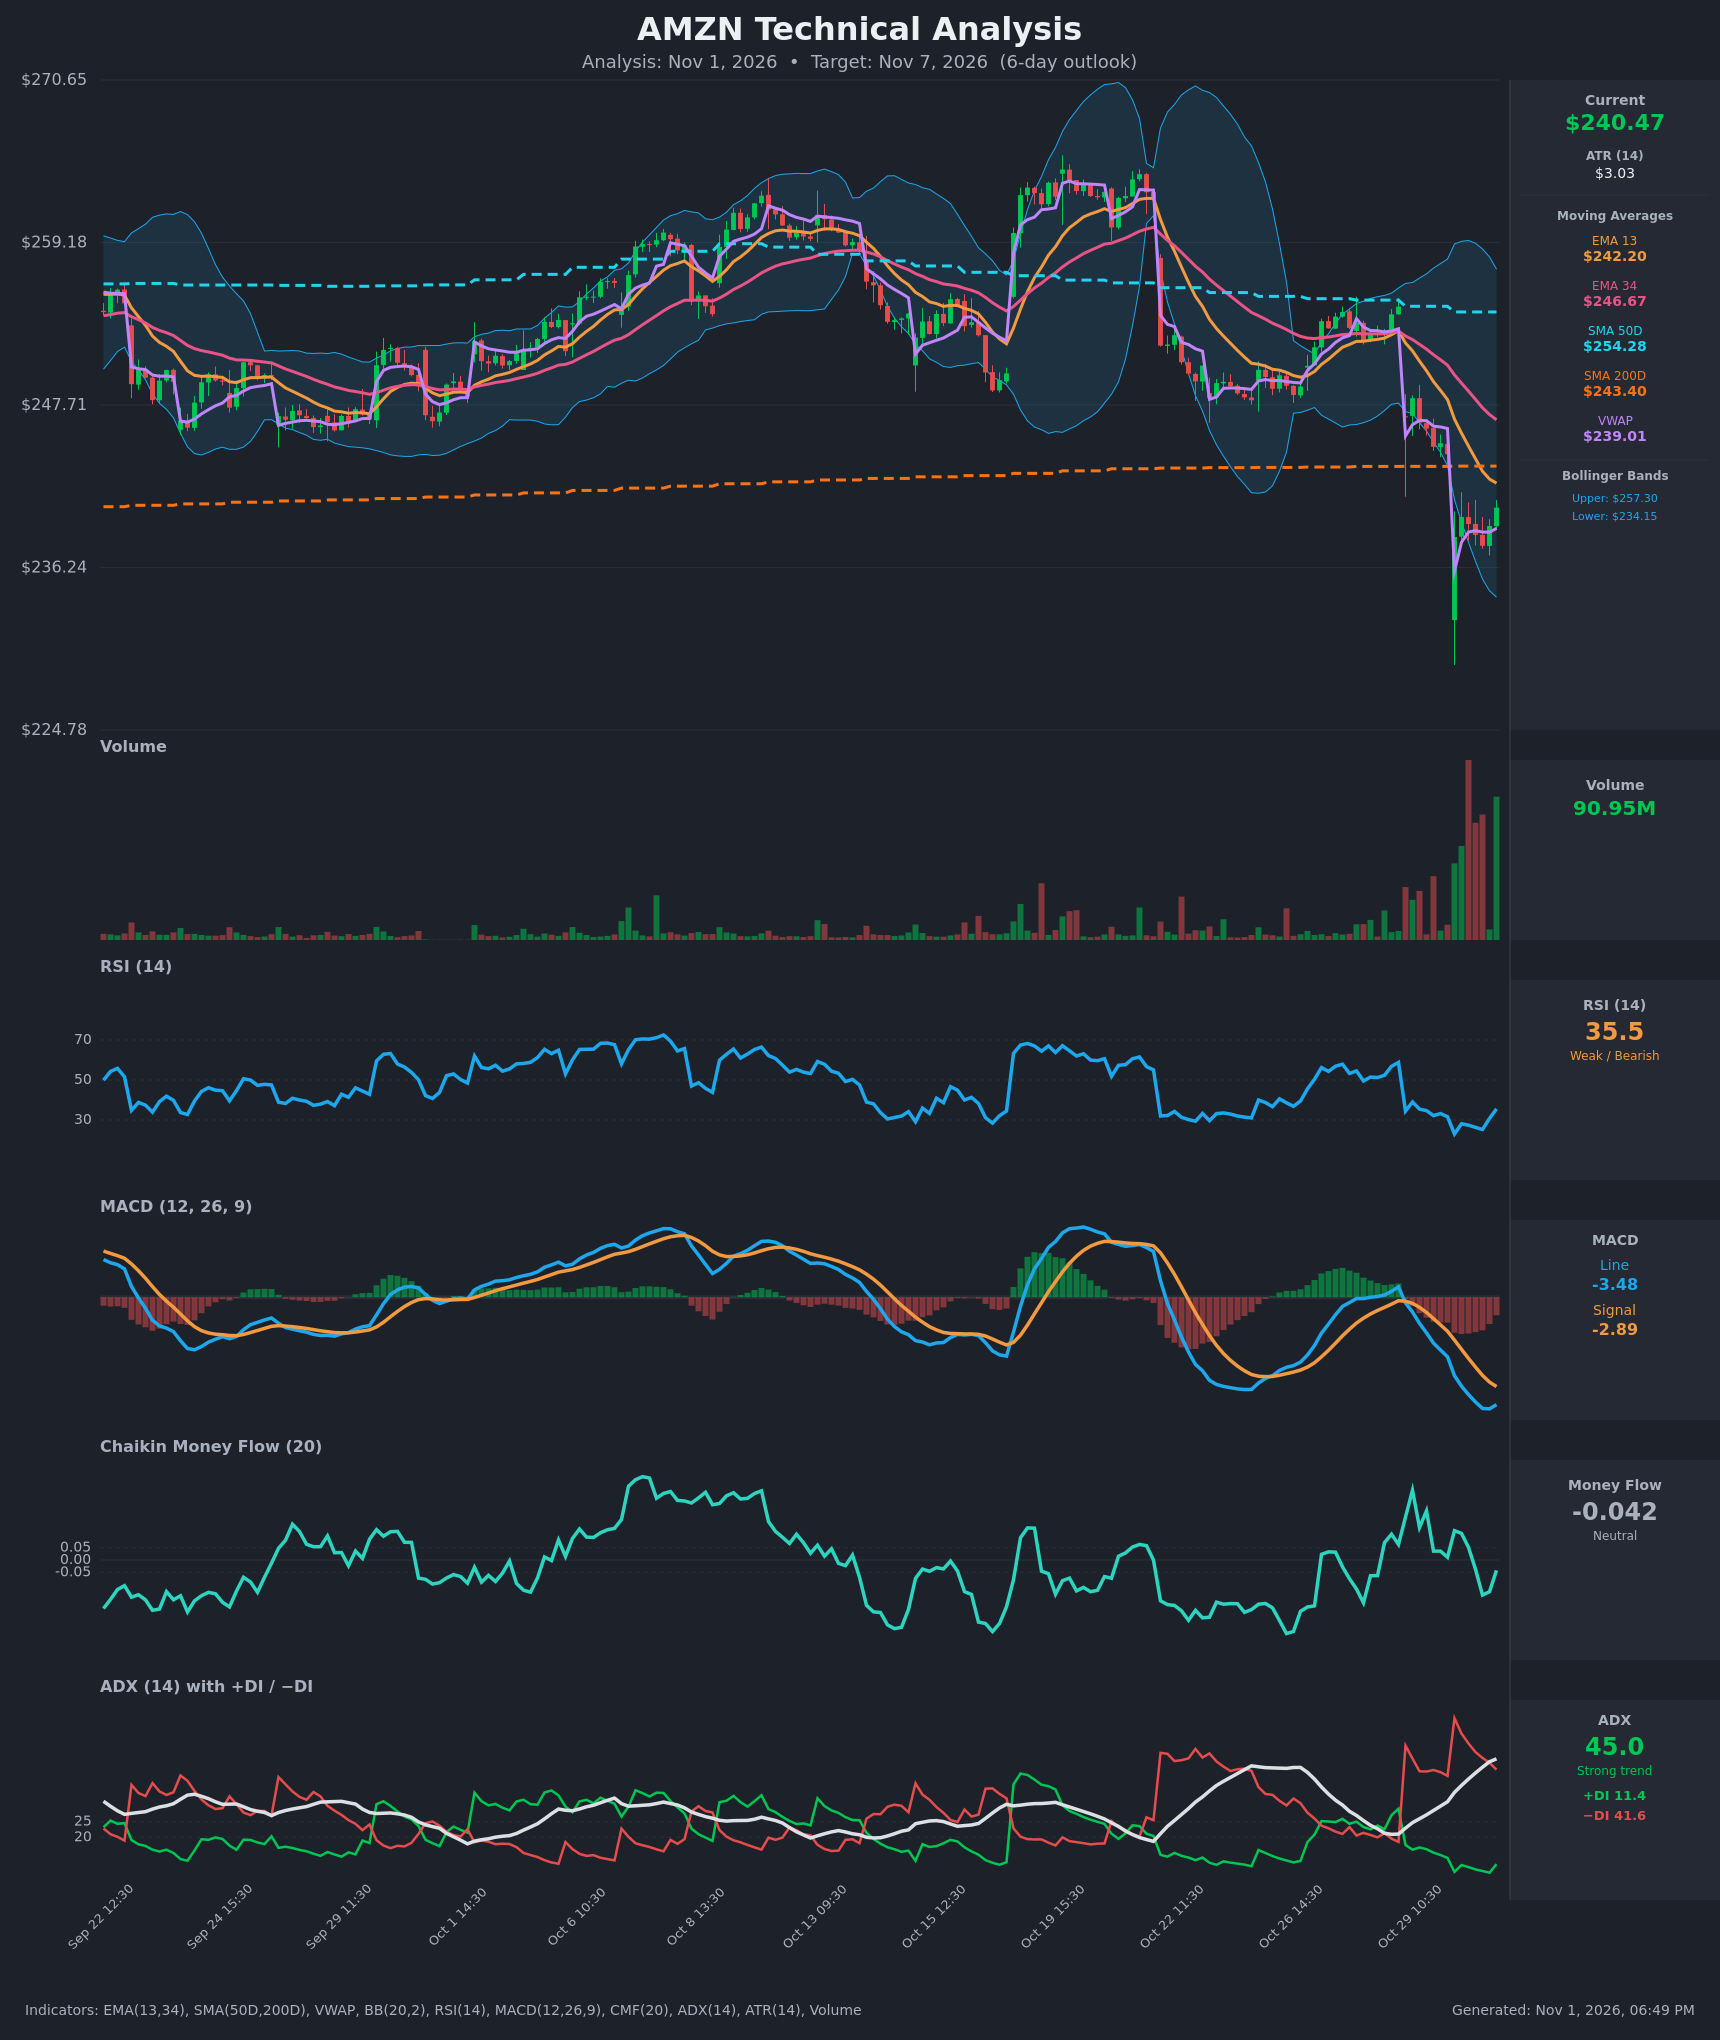
- RSI (14): 35.5, up from a low of 23.0 on Oct 30 09:30 and bouncing off oversold. It is still below 40 and has not regained the 50 midline, so the bounce is not yet confirmed as a reversal. [Bearish]
- 20 EMA: The supplied values are EMA 13 at $242.20 and EMA 34 at $246.67. Price at $240.47 is below both, and EMA 13 is below EMA 34, so a bearish alignment is in place. EMA 13 is the first overhead resistance, about $1.73 above price. [Bearish]
- MACD: The line is -3.48 and the signal is -2.89, so the line is below the signal. The histogram is about -0.59, narrowing from -0.87 a bar earlier, because the line ticked up from -3.615. This is early momentum stabilization, but there is no bullish crossover yet. [Bearish]
- Bollinger Bands (20): The bands run from $234.15 to $257.30, and price at $240.47 is in the lower third of the range. The Oct 30 open pierced the lower band (the wick low is near $230), then price recovered back inside. This suggests a short-term exhaustion bounce, but the bands are expanding and price is still well under the midline of about $245.7. [Neutral]
- CMF (20): -0.042 sits in the neutral band. It was as low as -0.142 on Oct 30 13:30 and has improved, so selling pressure is easing but no accumulation has appeared. [Neutral]
- ADX (14): 45.0 and rising, which is a very strong trend. -DI at 41.6 is far above +DI at 11.4, so bears are firmly in control. An ADX this high can also signal a late-stage, extended trend. [Strong Trend – Bearish]
- Volume: 90.95M is a huge spike compared with the prior weeks, with heavy red bars on the gap-down and a green bar on the latest session. This looks like capitulation or high-participation distribution. The latest green bar on high volume hints at a bounce, but it has not yet been validated by follow-through. [Heavy selling with a tentative relief bounce]
DIVERGENCES & TRENDS
- Possible early bullish RSI divergence: RSI made a low of 23 on the gap while price later probed lower, and the latest RSI of 35.5 is rising. There is no clean divergence yet, only a momentum rebound.
- MACD: The MACD line has been below the signal since Oct 29. It crossed bearishly near Oct 29 09:30 and has stayed there. The histogram is shrinking, a typical first sign of a bounce, not a trend change.
- Moving averages: EMA 13 crossed below EMA 34 (bearish) around Oct 29–30. SMA 50D at $254.28 is above SMA 200D at $243.40, so there is no death cross, but price has lost both. Price is also below SMA 200D, which is a key long-term break that now acts as resistance.
- DI/ADX: The -DI/+DI spread is wide and ADX is still climbing, so there is no sign of trend exhaustion in the directional data.
- VWAP: Price at $240.47 is slightly above VWAP at $239.01, a minor positive for the bounce.
- Gap: The Oct 30 gap down from about $244 to $238 is unfilled. Gap-fill pressure toward $243–245 matches the zone of the EMA 13 and SMA 200D, so that is a dense resistance zone.
CHART PATTERNS
- Bearish gap-and-go breakdown: From the Oct 19–28 range, price formed a lower-high sequence and then broke down through the $244–245 shelf and the SMA 200D. This resembles a Bearish Pennant / Flag continuation after the sharp drop. The small-bodied candles around $237–241 are the consolidation, and a break of the low near $237–238 would extend the measured move.
- Bounce possibility: The tight, small-range candles after the capitulation low could instead be a short-term Bullish Falling Wedge or double-bottom attempt. For that to work, price needs to reclaim $243.40 (SMA 200D). Until then it remains a weaker alternative.
- Targets: Bearish continuation points to $234 (lower BB) and then $230–231 (the Oct 30 wick low). A bullish retest points to $243.40–$246.
POTENTIAL SCENARIOS
- Scenario 1: Bearish Trend Continuation — Price fails at the EMA 13/SMA 200D overhead zone and rolls over as the strong -DI trend reasserts. Trigger: rejection at $242–243.40 or a break below $238. Target: $234–236, with a possible extension to $231. Invalidation: a daily close above $246.70 (EMA 34). (50% probability)
- Scenario 2: Bullish Relief Bounce / Gap Fill — An oversold bounce (RSI near 35, price back inside the lower BB, narrowing MACD histogram) fills the gap toward the EMA 34 and the middle of the Bollinger range. Trigger: a reclaim of $243.40 (SMA 200D) on rising volume. Target: $246–248. Invalidation: a break below $236. (32% probability)
- Scenario 3: Neutral Base-Building — Price chops between $237 and $243 as volatility cools after the capitulation volume. Trigger: failure to break either $237 or $243.40. Target: $238–242. Invalidation: a close outside the $236–$244 band. (18% probability)
PRICE TARGETS
- Target Price: $238.00 (6-day)
- Expected Range: $231.50 to $245.00 (width $13.50, about 5.6% of the current price, consistent with the 7-10 day guidance scaled down for 6 days)
- Key Levels: Support at $234.15 (lower Bollinger Band), Resistance at $242.20 (EMA 13), with heavier resistance at $243.40 (SMA 200D)
OVERALL BIAS
OVERALL BIAS: BEARISH - ADX at 45 with -DI (41.6) far above +DI (11.4), a MACD line below its signal, and price under the EMAs and SMA 200D point to continued downside. The RSI bounce and narrowing MACD histogram suggest a relief rally could occur first, but overhead resistance at $242–243.40 is likely to cap it.
This is educational analysis and not financial advice.