AMZN 4-day bearish forecast — Nov 1, 2026
- Bias: Bearish
- Timeframe: 4 days (made Nov 1, 2026, target date Nov 4, 2026)
- Price at analysis: $240.47
- Price target: $238.80
- Expected range: $234.00 – $245.50
- Result: Incorrect (+10.7%) — closed at $266.14 on Nov 4, 2026; quality score 0/100
Get a free AI analysis of AMZN today
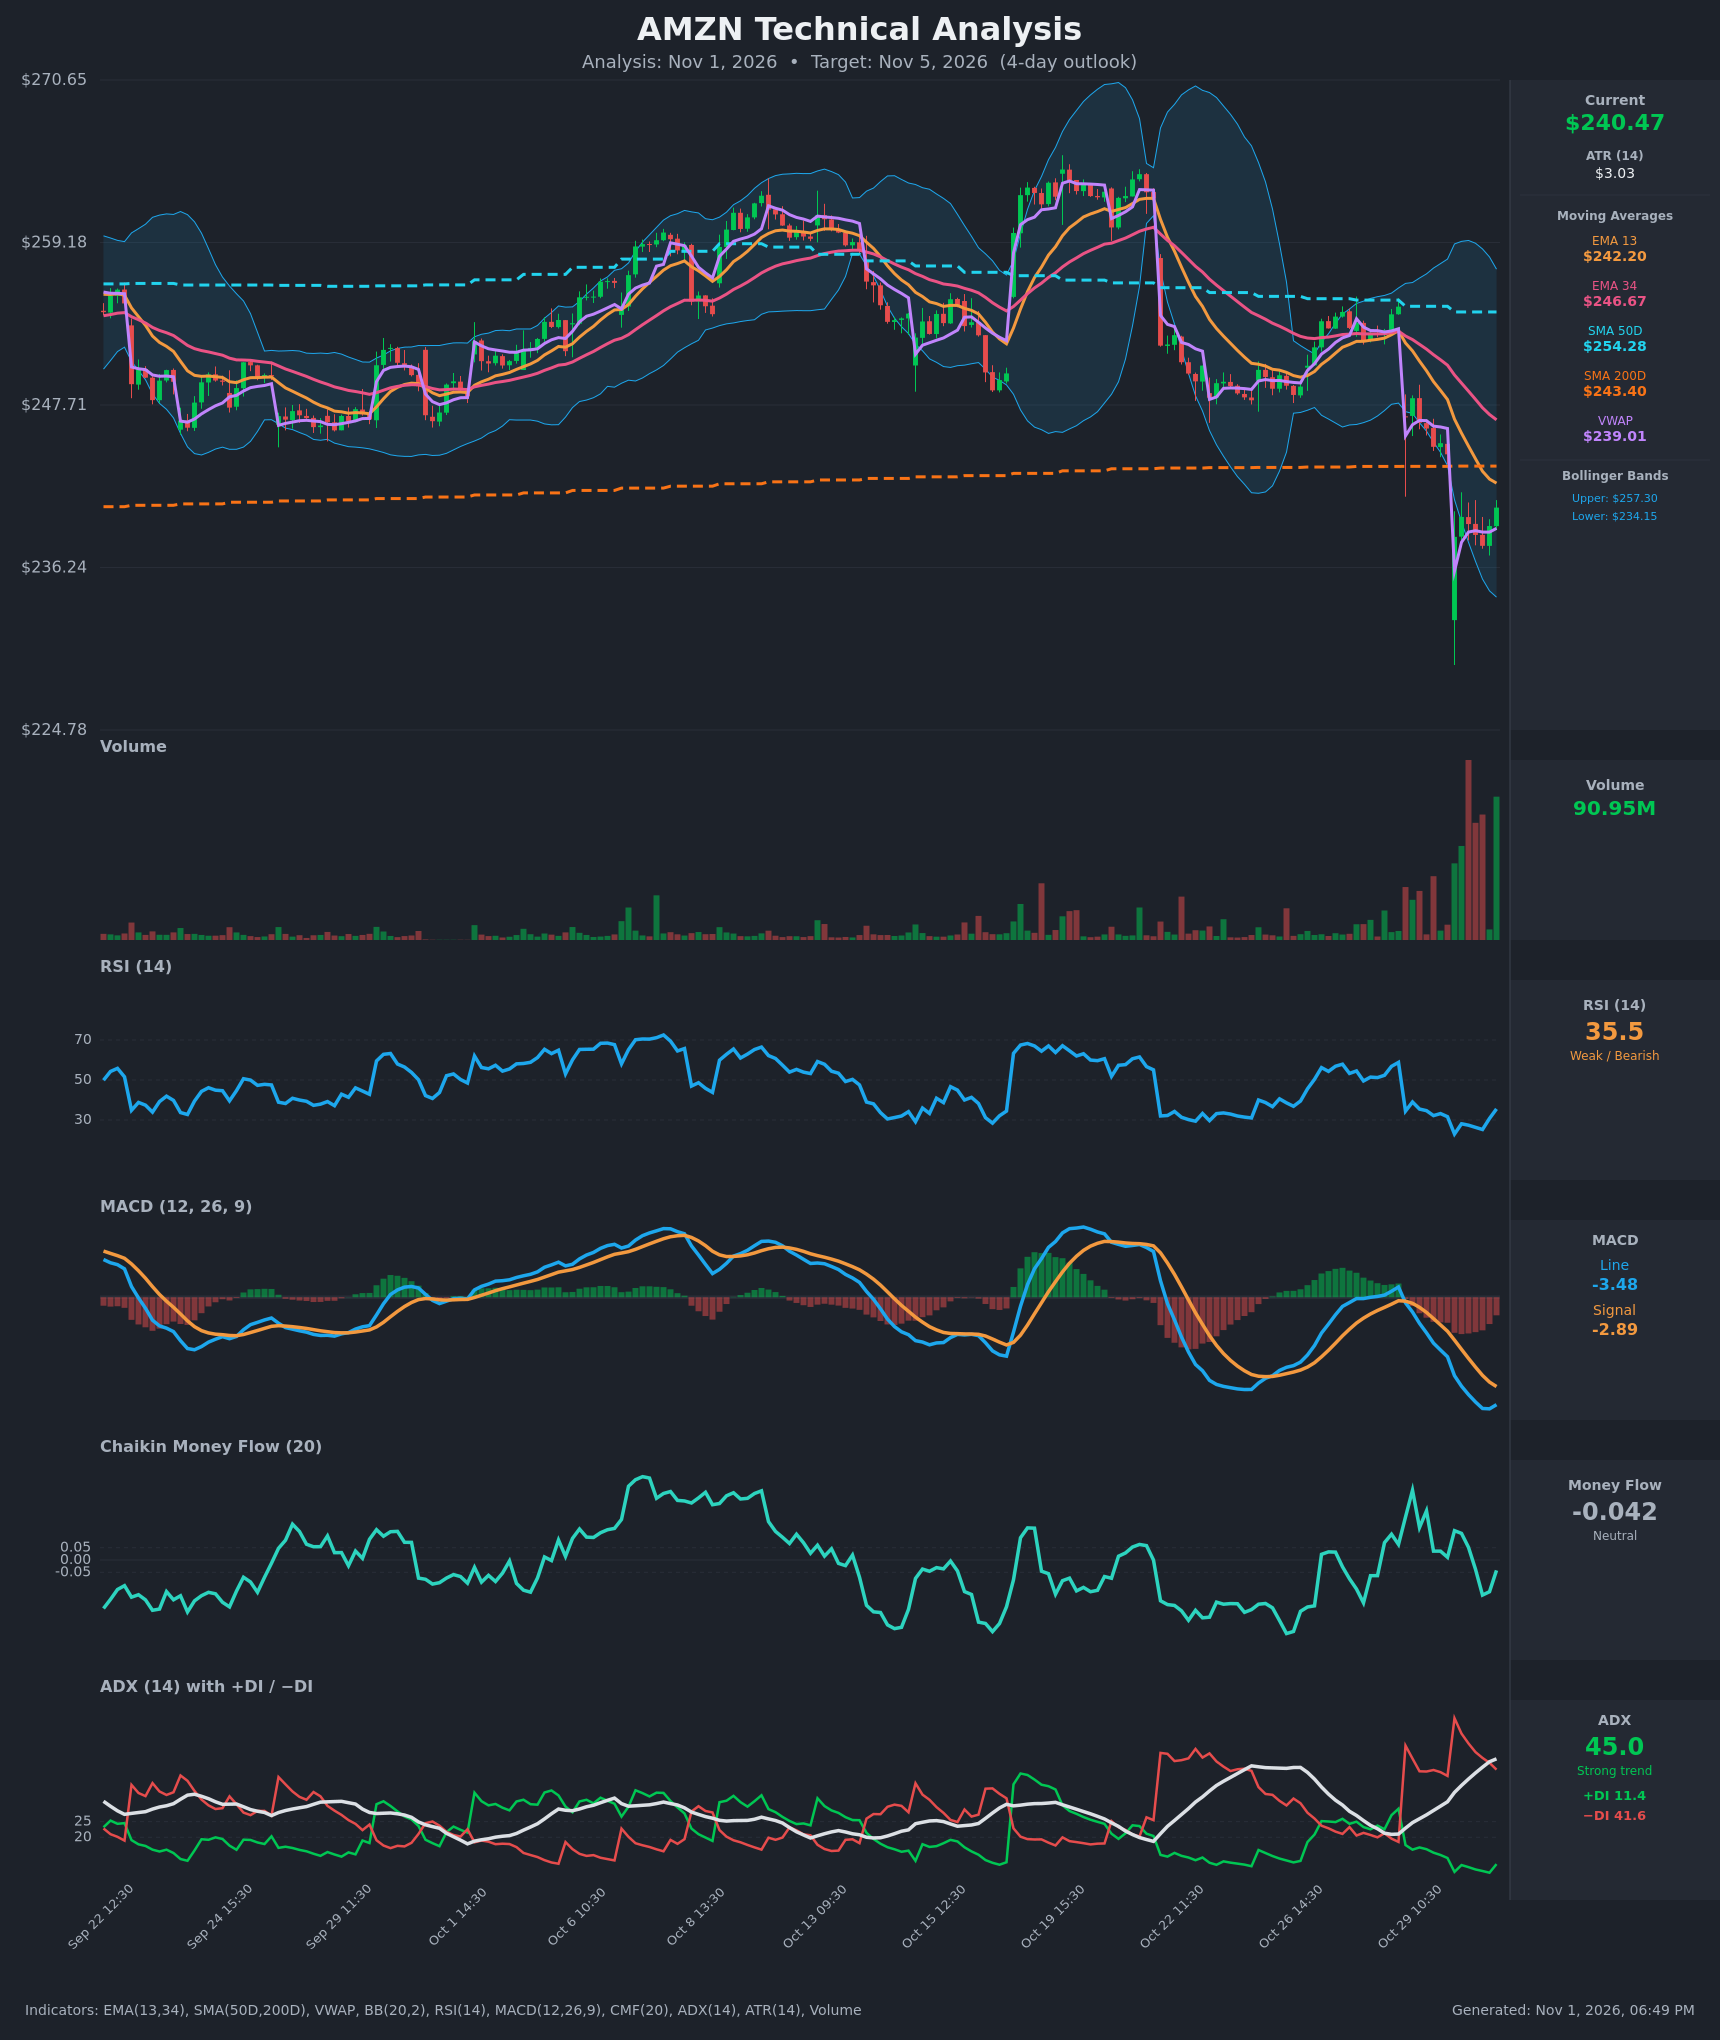
Analysis
TECHNICAL INDICATORS
- RSI (14): 35.54. It sank to an extreme 23.0 at the Oct 30 open and has bounced to 35.5, with the last four bars rising from 25.3. It is still below 50 and has not reclaimed 40, so this is a relief bounce inside a downtrend. [Bearish]
- 20 EMA: The supplied short EMA is the EMA 13 at $242.20, and price ($240.47) is below it. The EMA 34 is at $246.67 and the EMA 13 sits below it, so the bearish stack is intact and both slope down. Price is closing in on the EMA 13, which is the first overhead resistance. [Bearish]
- MACD: Line -3.479 is below signal -2.894, with a negative histogram of about -0.59. The histogram has narrowed from about -0.87 and the line has turned up slightly from -3.615. The bearish crossover from Oct 29 remains in force, but downside momentum is fading. [Bearish]
- Bollinger Bands (20): Upper $257.30, lower $234.15, middle roughly $245.70. Price is in the lower half after tagging or piercing the lower band on the gap-down and recovering about $6 from that low. The bands are wide after the volatility spike. A bounce to the midline near $245.7 is plausible, but price is below the mid-band. [Bearish]
- CMF (20): -0.042, in the neutral zone (between -0.05 and +0.05). It turned negative on Oct 30 12:30 (-0.038), bottomed near -0.142 and is recovering, so selling pressure is easing but there is no accumulation yet. [Neutral]
- ADX (14): 45.0 and rising, a very strong trend. −DI (41.6) is far above +DI (11.4), so bears are in firm control. The rising ADX with a widening DI gap confirms the downtrend, and readings above 40 can also precede exhaustion. [Strong Trend – Bearish]
- Volume: 90.95M on the latest bar, a multiple of normal, after a series of heavy-volume sessions. The heavy selling at the gap-down was followed by a green high-volume bar, which suggests some capitulation and dip-buying. That supports a bounce but does not yet confirm a reversal. [Capitulation / possible short-term bottom – unconfirmed]
DIVERGENCES & TRENDS
- Possible minor bullish divergence: Price made its low at the Oct 30 open, around $231, and the recent lows are higher. RSI went from 23 to 35.5, and the MACD histogram is shrinking. This points to a relief bounce, not a confirmed reversal.
- Moving averages: Price is below the EMA 13, EMA 34 and SMA 50 ($254.28), and it has slipped below the SMA 200 ($243.40). The SMA 50 is above the SMA 200, so there is no death cross, but the long-term support is lost.
- VWAP: Price ($240.47) is slightly above VWAP ($239.01), a mildly positive sign for the bounce.
- Trend: EMA 13 is accelerating down toward the EMA 34 and has already crossed below it (bearish). MACD and DI are both bearish and the post-gap structure is lower highs and lower lows. The most recent hourly bars show higher lows.
- Clustered resistance: The EMA 13 at $242.20 and the SMA 200 at $243.40 sit just overhead. Price is also close to the gap-down zone around $244–245.
CHART PATTERNS
- Bearish Flag / Pennant (small): After the sharp gap-down and drop, price is consolidating in a tight, slightly rising range around $237–241. This resembles the Bearish Flag/Pennant from the reference diagram. A break below about $237.5 would project a measured move toward the $232–234 area, in line with the Bollinger lower band.
- Larger structure: The rejection at $258–262 (Oct 19–23) followed by a lower high and the breakdown through the $245–247 support zone looks like a failed range, similar to a Bearish Head and Shoulders or Double Top. It is not perfectly textbook. The old $245–247 support is now resistance.
- No bullish reversal pattern is confirmed. A Falling Wedge or Double Bottom would need a close back above $243.4–$245.
POTENTIAL SCENARIOS
- Scenario 1: Bearish Failed Bounce / Flag Breakdown — The relief bounce stalls at the EMA 13 and the SMA 200 ($242.2–$243.4), then price rolls over as the −DI-led trend resumes. Trigger: rejection at $242–243.5 and a hourly close below $238. Target: $236–$234.15 (lower Bollinger Band). Invalidation: a daily close above $245.7 on rising volume. (47% probability)
- Scenario 2: Bullish Oversold Relief Rally — The capitulation volume, RSI rebound from 23 and MACD histogram narrowing drive a mean-reversion bounce to the mid-band and the gap area. Trigger: a hold above $239 and a break above $243.4. Target: $245.7–$247 (Bollinger midline, EMA 34, gap fill). Invalidation: loss of $237.5. (38% probability)
- Scenario 3: Neutral Choppy Digestion — Price consolidates around $238–$243 as the volatility spike digests. Trigger: failure to break either $237.5 or $243.4. Target: $239–$242. Invalidation: a close outside $237–$244. (15% probability)
PRICE TARGETS
For 4 days (target date Nov 5, 2026), at roughly 4.8% range width:
- Target Price: $238.80
- Expected Range: $234.00 to $245.50 (width $11.50, about 4.8% of current price, which fits a ~4-day horizon)
- Key Levels: Support at $234.15 (lower Bollinger Band, near the post-gap low zone), Resistance at $243.40 (SMA 200, with the EMA 13 at $242.20 just below it)
OVERALL BIAS
OVERALL BIAS: BEARISH - ADX at 45 with −DI (41.6) far above +DI (11.4), price below the EMA 13, EMA 34, SMA 50 and SMA 200, and a bearish MACD cross point to trend continuation. The bounce into $242–243.4 resistance is more likely to fade than extend, although oversold RSI and the capitulation volume make a relief rally a close second scenario, so conviction is modest.
This is educational analysis and not financial advice.