CRWV 4-day bearish forecast — Nov 1, 2026
- Bias: Bearish
- Timeframe: 4 days (made Nov 1, 2026, target date Nov 4, 2026)
- Price at analysis: $54.98
- Price target: $53.60
- Expected range: $51.60 – $55.60
- Result: Correct (-11.9%) — closed at $48.42 on Nov 4, 2026; quality score 50/100
Get a free AI analysis of CRWV today
Analysis
TECHNICAL INDICATORS
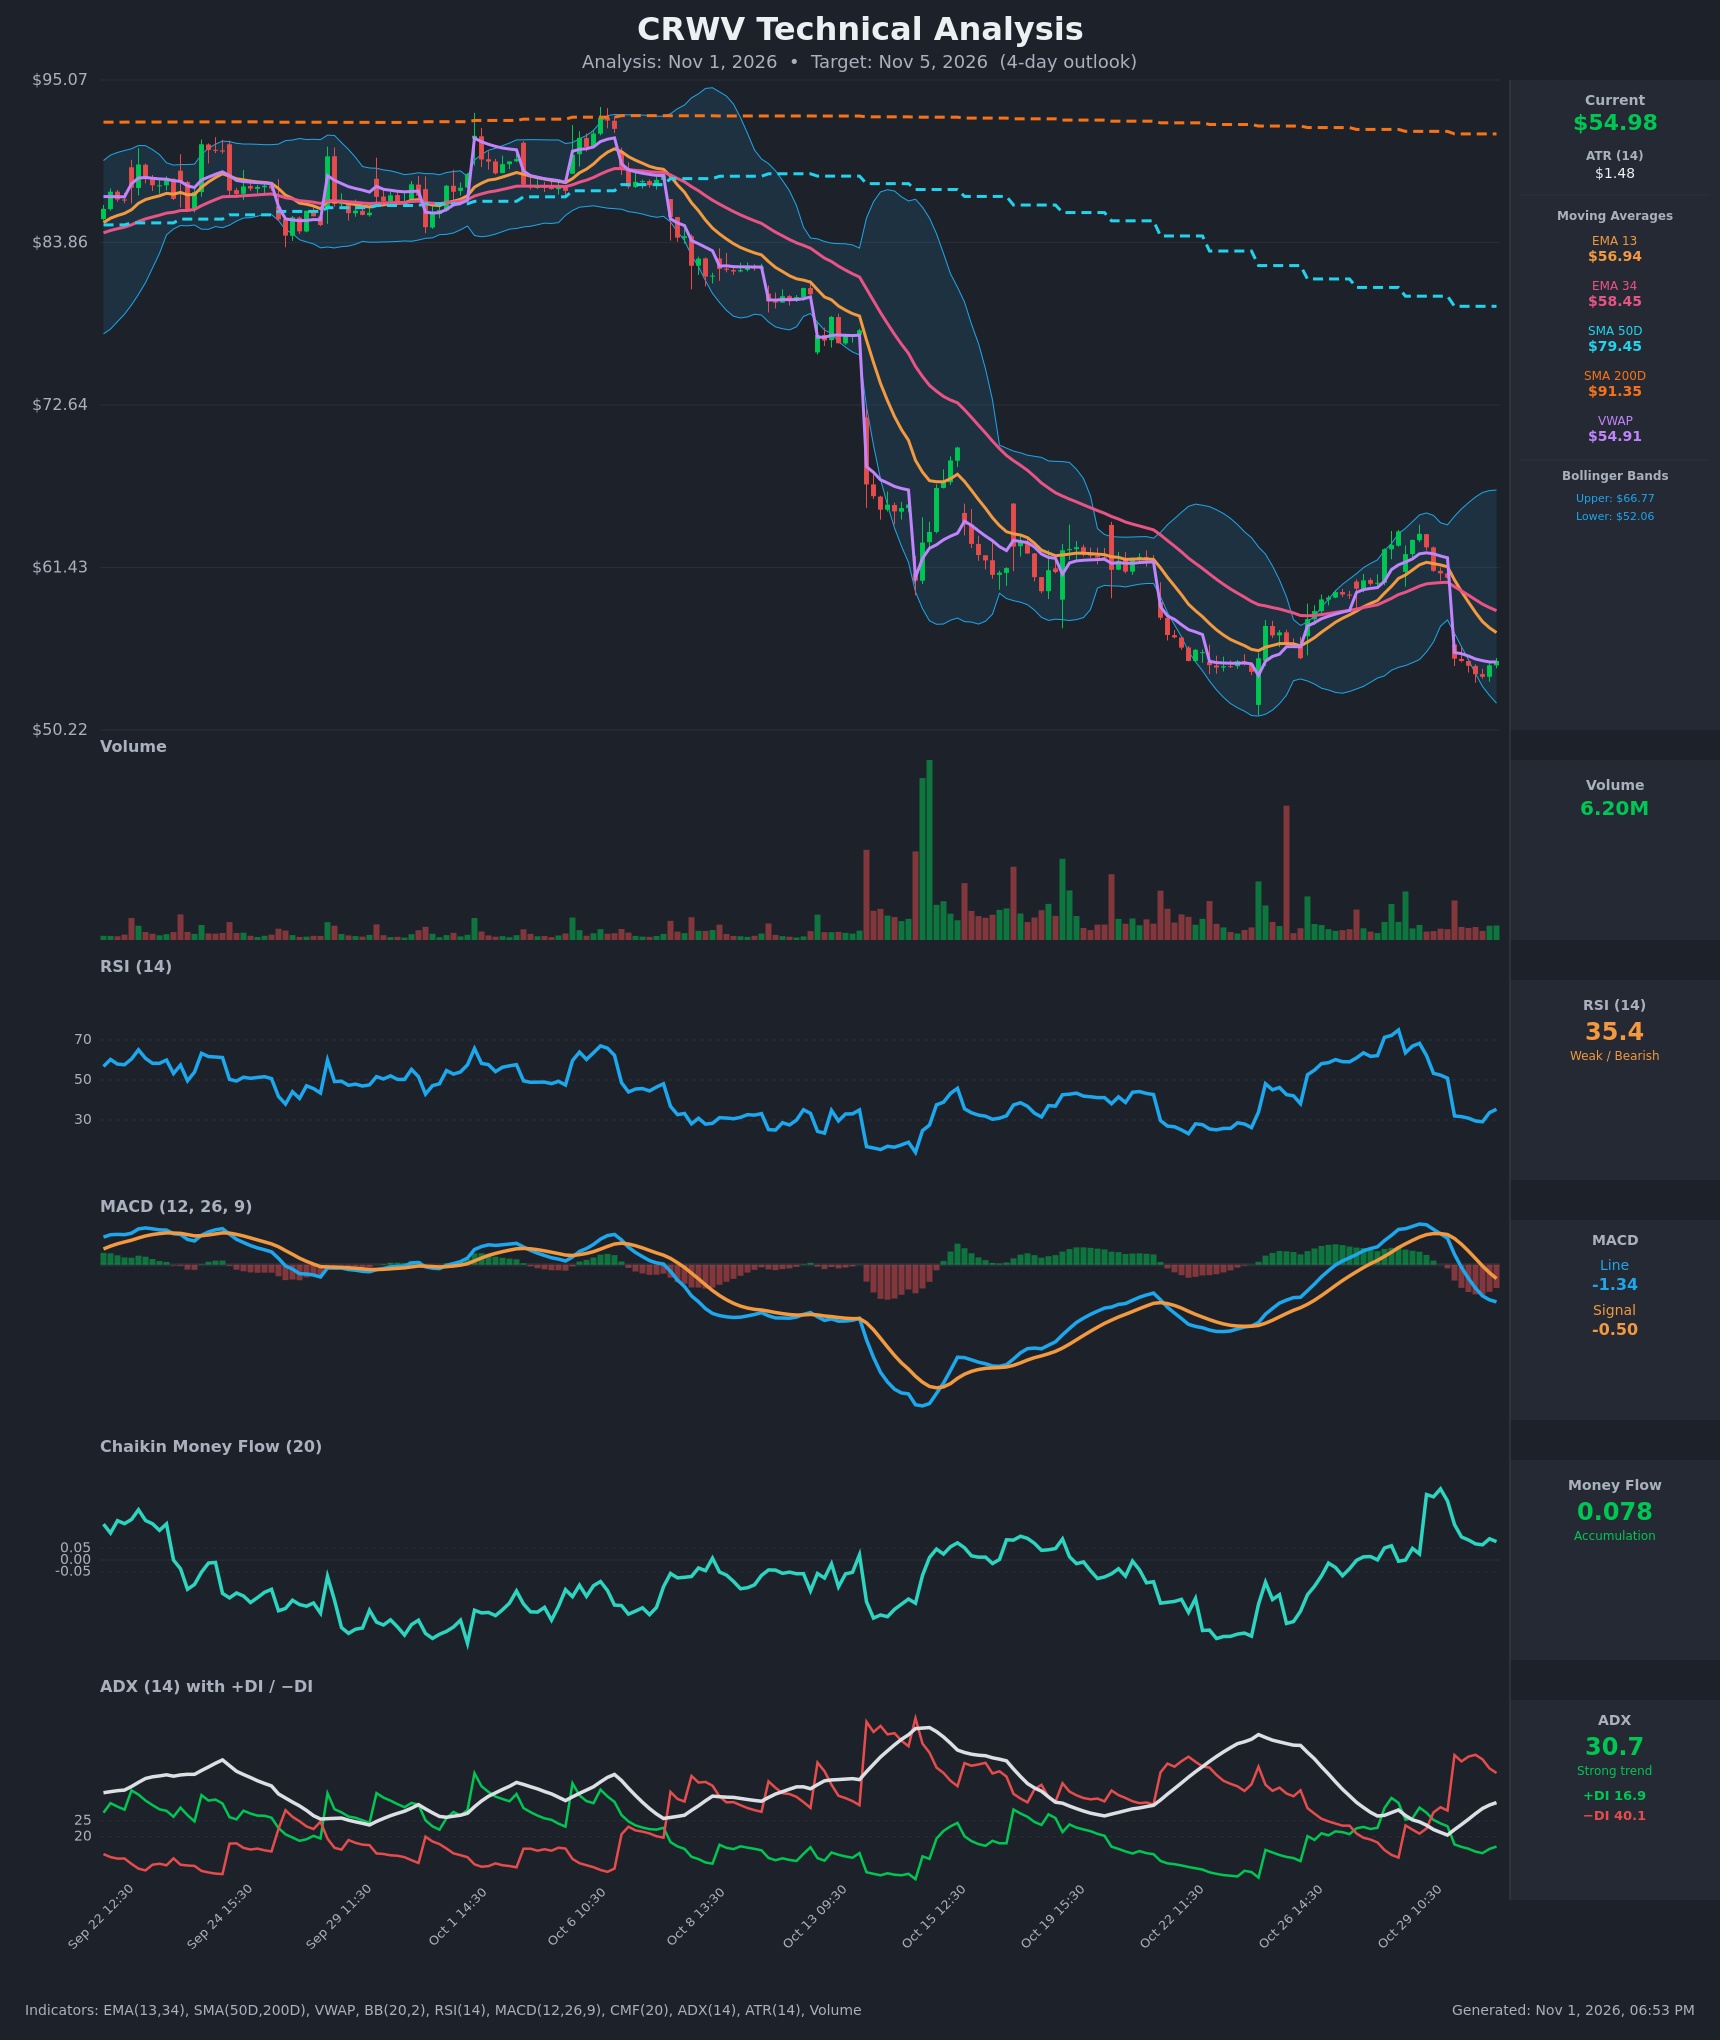
- RSI (14): 35.39, rebounding slightly from 29.1 but still below 40. It fell from an overbought 75 on Oct 28 to oversold in two sessions. Momentum is bearish but stretched. [Bearish]
- 20 EMA: The data gives EMA 13 at $56.94 and EMA 34 at $58.45. Price at $54.98 is below both, and both are sloping down. EMA13 crossed below EMA34 around Oct 30 10:30, which is a fresh bearish cross. Both averages are overhead resistance. [Bearish]
- MACD: Line -1.34 is below signal -0.50 after a bearish cross on Oct 30 10:30. The histogram is negative and widening (about -0.84). The line is still falling, though the pace is slowing. [Bearish]
- Bollinger Bands (20): Upper $66.77, lower $52.06, so price sits in the lower third of the band, about 20% of the way up from the lower band. Price tagged the lower band area near $53.89 and bounced slightly. The bands are wide, which shows elevated volatility. A close below the lower band would signal continuation. [Bearish]
- CMF (20): 0.078, above the +0.05 threshold and positive for several sessions. It is slightly accumulative, but it is falling from its recent peak and diverges from the price drop. [Accumulation]
- ADX (14): 30.7 and rising, with −DI 40.1 well above +DI 16.9. This is a strong trend with bears firmly in control. [Strong Trend – Bearish]
- Volume: 6.20M, subdued compared with the heavy-volume selloff days earlier in October. The recent gap-down on Oct 30 had no panic-level follow-through. Price is sitting at VWAP ($54.91), which acts as a pivot. [Neutral to slightly Bearish]
DIVERGENCES & TRENDS
- Trend: A long-term downtrend. Price is far below SMA50D ($79.45) and SMA200D ($91.35). SMA50D has been below SMA200D, so the death cross is already in place. Lower highs and lower lows are intact on the daily structure.
- Short-term: After the Oct 22-28 bounce to about $64, price gapped down on Oct 30 from about $60.72 to $55.14, an ~9% drop. It has since held the $53.89–$55 zone.
- Divergence: CMF is positive while price is falling. This is mild bullish divergence, a sign of possible accumulation near $54. RSI made no new low (29.1 versus the earlier ~25 low in mid-October), but this is not a clean divergence.
- Crossovers: The EMA13/34 bearish cross and MACD bearish cross both occurred on Oct 30. Price is sitting on VWAP, with the VWAP reset from the gap-down.
- Indicator trends: −DI is dominant and ADX is rising, confirming trend strength. RSI is hooking up slightly from 29, hinting at a minor oversold bounce.
CHART PATTERNS
- Bearish gap-down / continuation: After a rally from the ~$51 low to ~$64, the sharp drop resembles a bearish rising wedge or failed-rally structure. The rally off the late-October low retraced fully and broke below the rising base.
- Possible Bearish Flag: Small consolidation in the $53.9–$55 area after the gap-down. A flag break lower would imply a measured move of roughly $2-3 beyond the breakdown, toward $51-52.
- Support test: The October low near $51 is key. A break below it would open a leg lower. Holding it would create a potential Bullish Double Bottom, which is not confirmed yet.
- Targets: On a breakdown, $51–52. On a bounce, resistance is the EMA13 near $56.94 and then the EMA34 near $58.45.
POTENTIAL SCENARIOS
- Scenario 1: Bearish Continuation Lower — Strong −DI, a rising ADX, and a MACD/EMA bearish cross favor another leg down toward the October lows and the lower Bollinger Band. Trigger: Break below $53.89 session low with volume. Target: $51.50–$52.50. Invalidation: Daily close above $57.00 (EMA13). (50% probability)
- Scenario 2: Neutral Consolidation at Support — Price holds VWAP and the $52–$56 zone as RSI resets from oversold and CMF supports it. Trigger: Range-bound closes between $53.50 and $56.50. Target: $54–$56. Invalidation: Close above $57 or below $52. (20% probability)
- Scenario 3: Bullish Oversold Bounce — Oversold relief with positive CMF lifts price to retest the EMAs. Trigger: Reclaim of $56.00 with rising volume. Target: $57.00–$58.50. Invalidation: Close below $53.50. (30% probability)
PRICE TARGETS
- Target Price: $53.60 (4-day horizon, Nov 5, 2026)
- Expected Range: $51.60 to $55.60 (width $4.00, about 7.3% of current price, appropriate for a 4-day horizon given ATR of $1.48)
- Key Levels: Support at $52.06 (lower Bollinger Band / near October low area), Resistance at $56.94 (EMA 13)
OVERALL BIAS
OVERALL BIAS: BEARISH - The trend is strongly down (ADX 30.7 with −DI 40.1 versus +DI 16.9), price is below all key moving averages, and fresh bearish MACD and EMA crosses point to continued weakness. Positive CMF and a near-oversold RSI cap the downside, suggesting a modest drift toward the lower band rather than a collapse.
This is educational analysis and not financial advice.