CRWV 27-day bearish forecast — Nov 15, 2026
- Bias: Bearish
- Timeframe: 27 days (made Nov 15, 2026, target date Dec 11, 2026)
- Price at analysis: $53.13
- Price target: $50.50
- Expected range: $46.00 – $55.50
- Result: Pending — graded after the close on Dec 11, 2026
Get a free AI analysis of CRWV today
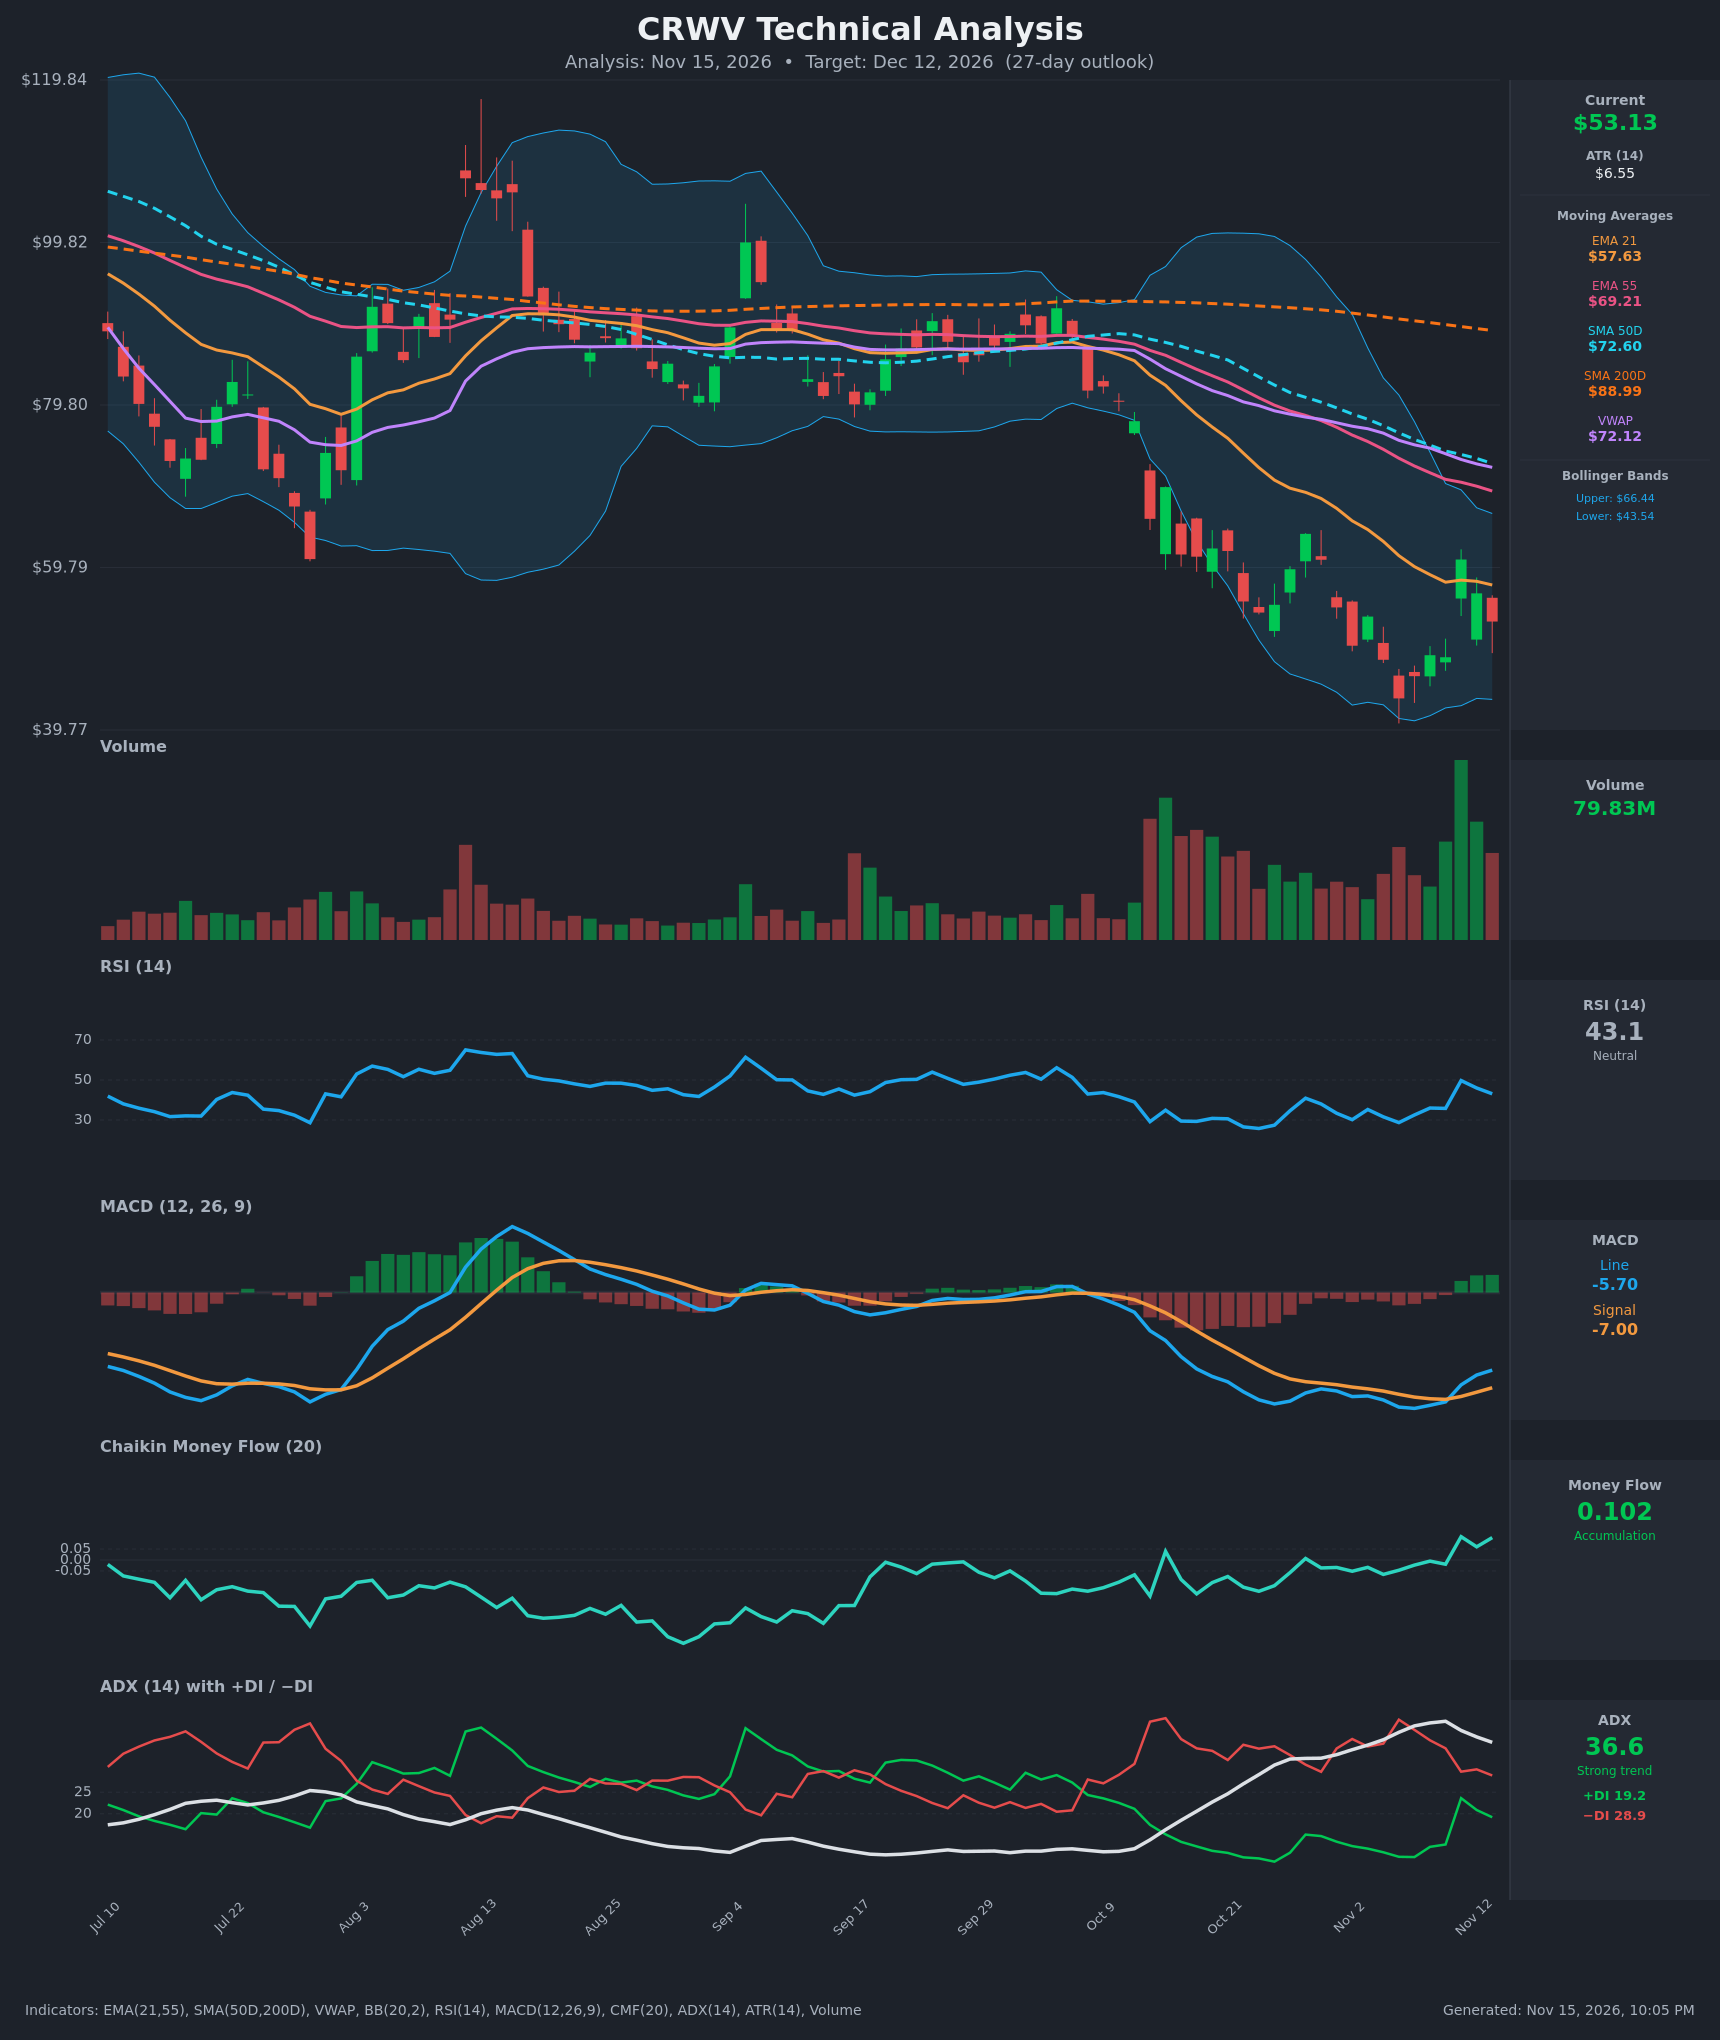
Analysis
TECHNICAL INDICATORS
- RSI (14): 43.11, down from 49.7 on Nov 11 after rejection near the 50 line. It bounced from oversold (27.4 on Oct 26, 28.7 on Nov 5) but is rolling over again below the midline, a pattern typical of a downtrend relief rally. [Bearish]
- 20 EMA: The EMA 21 is $57.63 and price at $53.13 is below it. The EMA 21 is also well below the EMA 55 ($69.21), and price has failed at the EMA 21 on the last two bars. The EMA 21 is acting as resistance. [Bearish]
- MACD: The line (-5.70) is above the signal (-6.999), a bullish crossover on Nov 11, with a positive histogram of about +1.3. Both lines are still deep below zero, so this is a momentum recovery inside a downtrend, not a trend reversal. [Neutral]
- Bollinger Bands (20): Upper $66.44, lower $43.54, midline about $55. Price is just below the midline after bouncing from the lower band (the $43.66 low on Nov 5). The bands are wide after the selloff, and the midline is sloping down and capping rallies. [Bearish]
- CMF (20): 0.102, above the +0.05 threshold after being negative for most of the decline. That signals some accumulation on the capitulation volume, a genuine counterpoint to the trend. [Accumulation]
- ADX (14): 36.6, a strong trend, but down from the 41.5 peak. −DI (28.9) is above +DI (19.2), so bears are in control, although +DI has recovered from about 10. [Strong Trend – Bearish]
- Volume: 79.83M, heavy and well above the earlier average, with the largest bars on the capitulation and bounce days. The Nov 11 spike (+25%) was followed by two red days, which suggests a failed relief rally. [Elevated – Distribution risk on bounces]
DIVERGENCES & TRENDS
- MACD: It made a higher low (-8.52 on Nov 6, versus a deeper trough earlier) and crossed above its signal line. This is a mild bullish momentum divergence, but it has not confirmed with a break above resistance.
- RSI: The Nov 5 low of 28.7 was not far below the Oct 26 low of 27.4 even though price made a new low. This is a mild bullish divergence. RSI is now failing under 50, which weakens it.
- CMF: It rose above +0.05 while price stayed low, a bullish divergence in money flow.
- Moving averages: The SMA50 ($72.60) is below the SMA200 ($88.99), a death cross with both sloping down. Price is below the SMA200, VWAP ($72.12), SMA50, EMA 21 and EMA 55. This is a clear long-term downtrend.
- ADX: It has started to fall from its peak, which suggests the downtrend is maturing and a base or consolidation could form. −DI is still on top.
- Price structure: Lower highs ($63.93, then $60.77) and lower lows ($43.66) are intact.
CHART PATTERNS
- Bearish flag / pennant (continuation) – primary read: After the sharp drop from about $85 to $44, the choppy bounce into $60–64 with lower highs resembles a bear flag. A break below about $48 would project a measured move toward the high $30s or low $40s. A 27-day target is more conservative than the full measured move.
- Possible Bullish Double Bottom (reversal) – secondary and unconfirmed: The lows near $43.66 and $46.40 are forming a potential base. It needs a close above the roughly $60–64 neckline (above the EMA 21) to confirm, and that is far from current price.
- Overall the larger structure is a downtrend with a lower-high sequence, so continuation is somewhat more likely than reversal.
POTENTIAL SCENARIOS
- Scenario 1: Bearish Failed Relief Rally / Bear Flag Continuation — Price remains capped by the EMA 21 and the declining Bollinger midline, and −DI stays on top. Sellers push back toward the November lows. Trigger: a daily close below $48.40, the Nov 4 and Nov 10 area. Target: $46.00 first, then $43.60 (the lower band and Nov 5 low), with $50.50 as the expected 27-day level. Invalidation: a daily close above $58 (the EMA 21 reclaimed) with MACD staying above its signal. (50% probability)
- Scenario 2: Bullish Base and Mean-Reversion Bounce — CMF accumulation and the MACD cross hold, and price builds a double-bottom base above $46. Trigger: a close above $57.63 with RSI back above 50. Target: $60.80 (the Nov 11 spike high), then $64–66 (upper band). Invalidation: a close below $46.40. (35% probability)
- Scenario 3: Neutral Range Consolidation — With ADX fading, price chops between about $47 and $57 as the market digests the volatility. Trigger: failed breaks on both sides. Target: $52–54. Invalidation: a daily close outside $46–$58. (15% probability)
PRICE TARGETS
- Target Price: $50.50 (27-day)
- Expected Range: $46.00 to $55.50 (width $9.50, about 17.9% of the current price, consistent with a 27-day horizon)
- Key Levels: Support at $48.40, Resistance at $57.63
OVERALL BIAS
OVERALL BIAS: BEARISH - Price is below every major moving average, −DI dominates with ADX at 36.6, and the sequence of lower highs and the rejection at the EMA 21 point to a failed relief rally. The MACD cross and positive CMF reduce conviction and keep a bounce scenario alive, but the trend evidence outweighs them.
This is educational analysis and not financial advice.