CRWV 20-day bullish forecast — Nov 15, 2026
- Bias: Bullish
- Timeframe: 20 days (made Nov 15, 2026, target date Dec 4, 2026)
- Price at analysis: $53.13
- Price target: $55.00
- Expected range: $50.00 – $56.50
- Result: Pending — graded after the close on Dec 4, 2026
Get a free AI analysis of CRWV today
Analysis
TECHNICAL INDICATORS
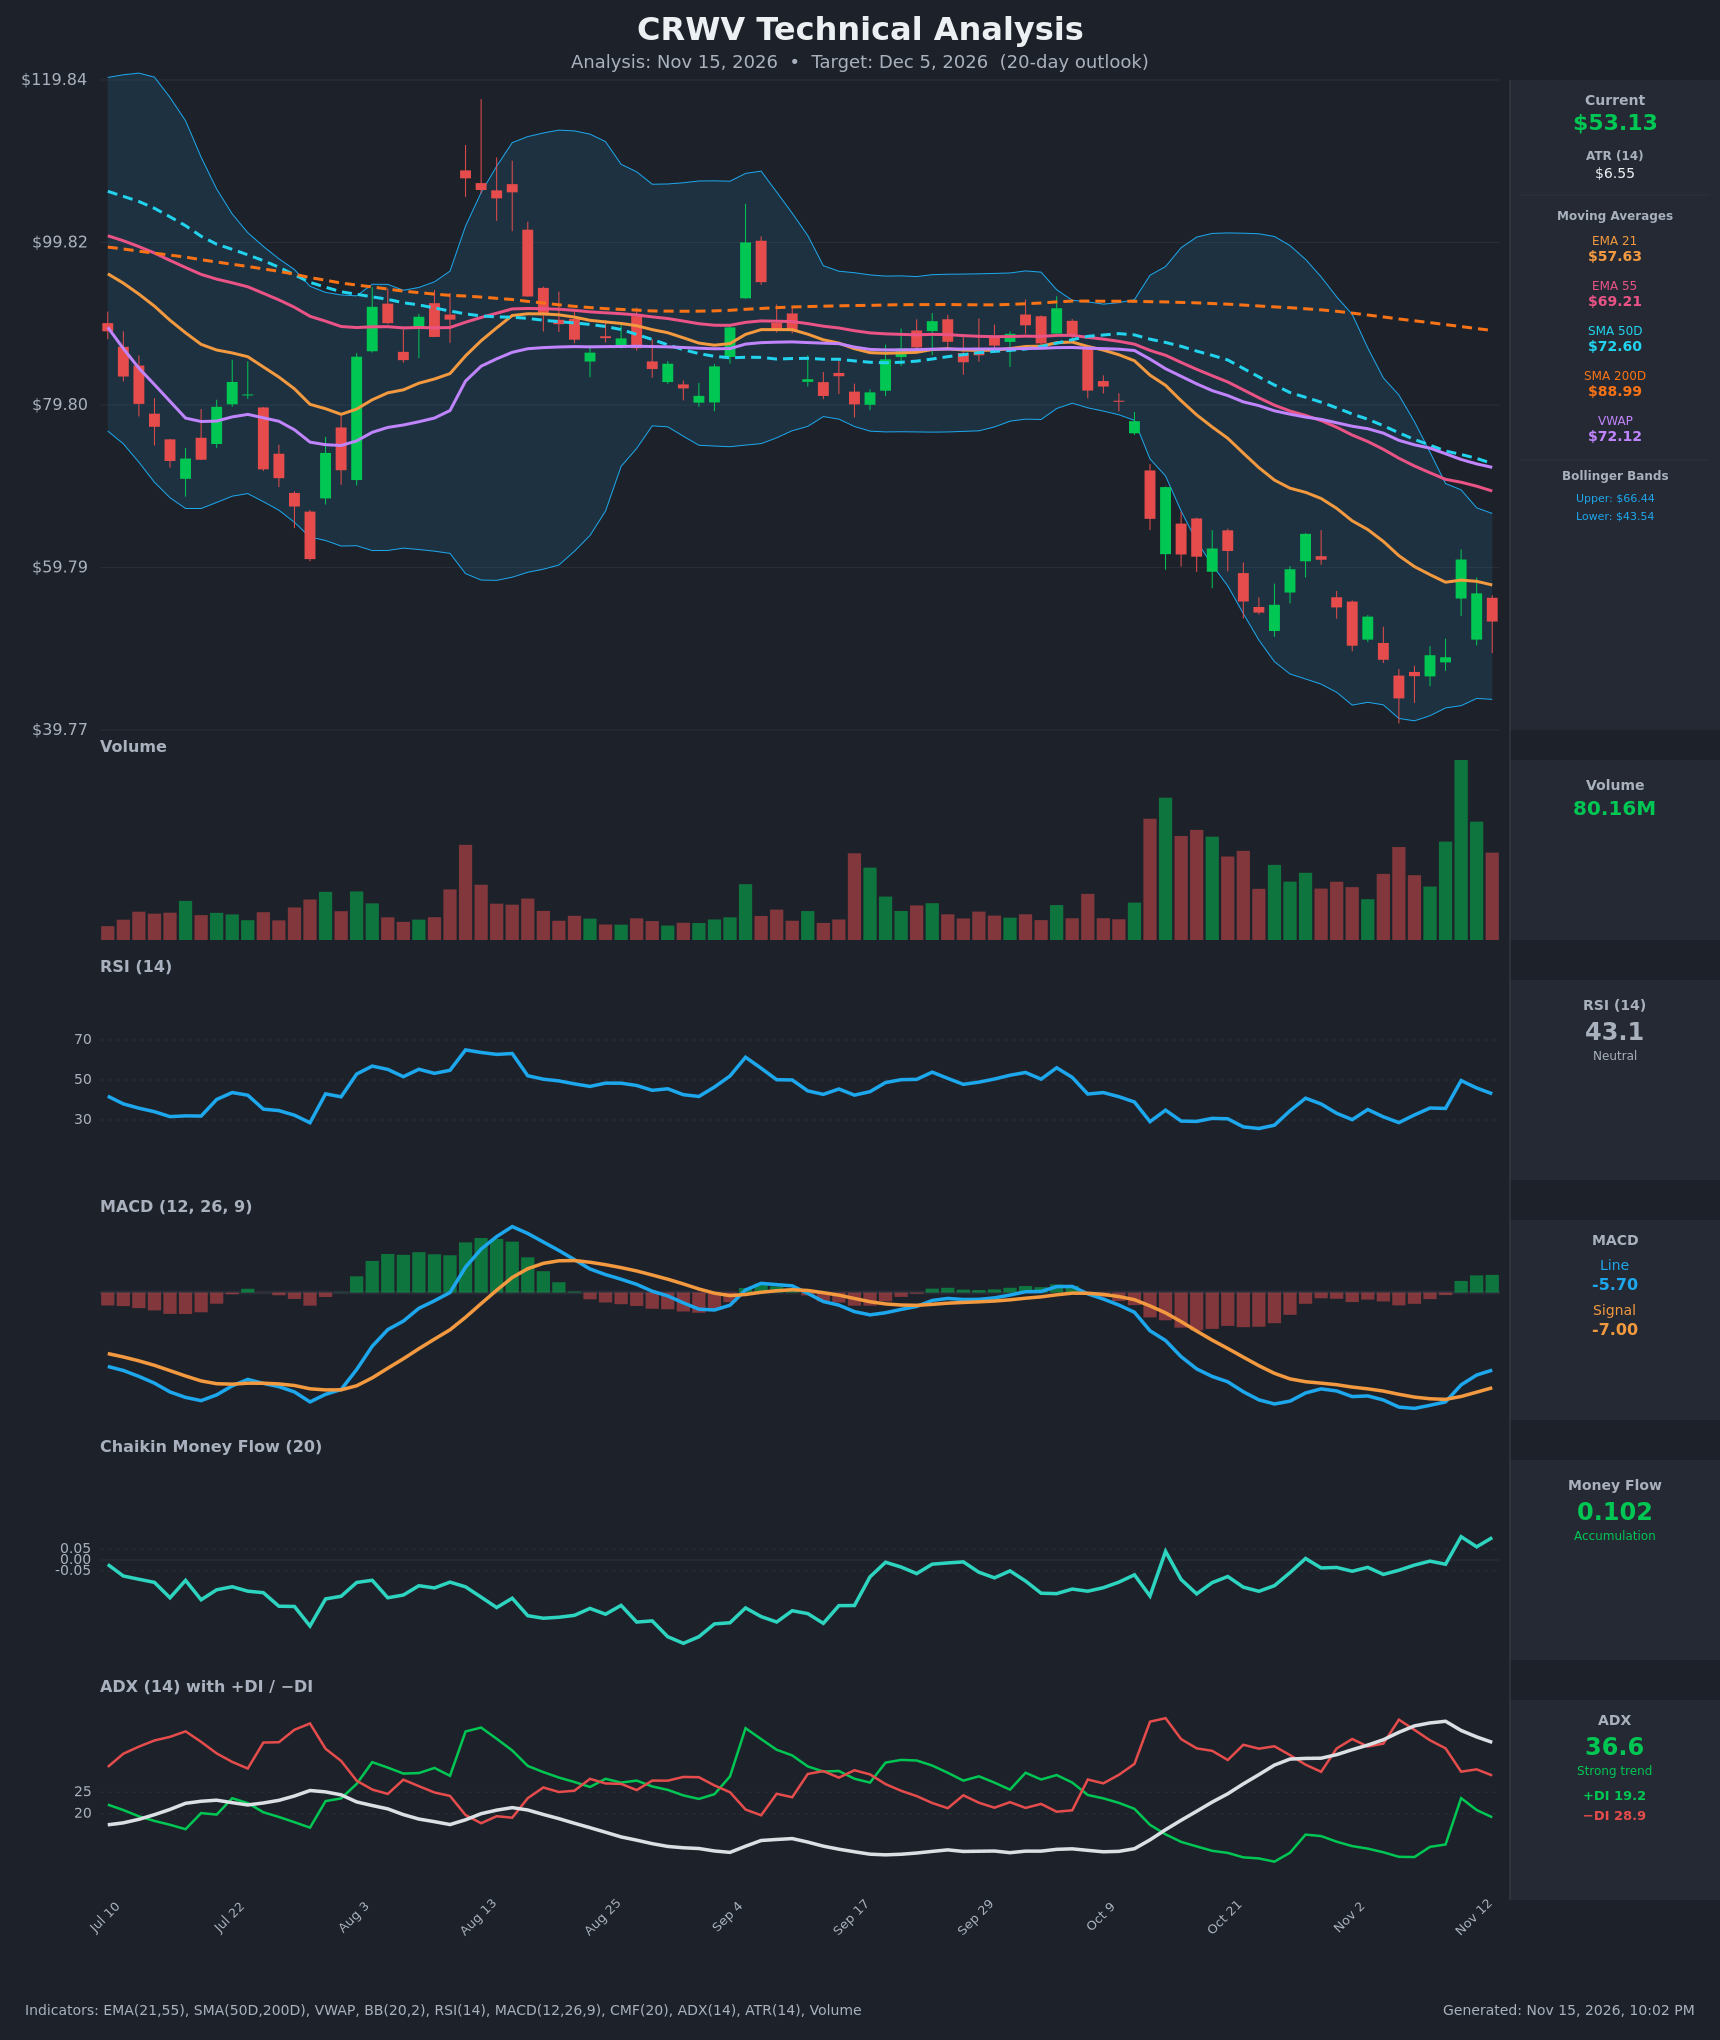
- RSI (14): 43.1, recovering from oversold lows (27.4 on Oct 26, 28.7 on Nov 5). It peaked at 49.7 on Nov 11 and has rolled over to 43.1 for two sessions. Still below 50, but the lows are rising. [Neutral]
- 20 EMA: The EMA 21 is $57.63 and price ($53.13) is below it, so it acts as overhead resistance. The EMA 21 is also well below the EMA 55 ($69.21), a bearish stack. The EMA 21 is flattening (about $58) after a steep decline. [Bearish]
- MACD: Line -5.70 is above signal -7.00, with a bullish crossover on Nov 11. The histogram is positive and expanding, and the line is climbing from its lows. Both are still deeply negative, so this is a relief signal inside a larger downtrend. [Bullish]
- Bollinger Bands (20): Upper $66.44, lower $43.54, middle about $55. Price is in the lower half, just under the midline, after touching the lower band in early November. The bands are wide, which means high volatility. A move back to the midline (about $55) is plausible, and a close above it would confirm the bounce. [Neutral]
- CMF (20): 0.102, above +0.05 and the best reading in months, moving up from -0.117 on Oct 26. Buying pressure is building despite weak price, which hints at accumulation near the lows. [Accumulation]
- ADX (14): 36.6 and slipping from a 41.5 peak, with -DI at 28.9 above +DI at 19.2. The trend is still strongly bearish, but it is losing steam as +DI recovers from 8.9. [Strong Trend – Bearish, weakening]
- Volume: 80.16M, very high and near the peak of the whole chart. The heavy volume on the Nov 11 spike (+$12) and the red candles that followed shows two-way, volatile participation. It reads as capitulation or washout activity rather than orderly distribution. [Elevated – potential capitulation/base-building, but sellers still active]
DIVERGENCES & TRENDS
- Bullish divergence: Price made a lower low on Nov 5 ($43.66 close) while RSI (28.7 vs 27.4) and MACD histogram stayed higher than at the late-October low. This suggests selling momentum is fading.
- CMF vs. price: CMF has turned positive while price is still below every moving average. Money flow is leading price higher.
- Bearish backdrop:
- Price is below the SMA 200D ($88.99), SMA 50D ($72.60), VWAP ($72.12), EMA 21 and EMA 55.
- The SMA 50D is well under the SMA 200D, so the death cross is already in place.
- The trend of lower highs persists: $63.93 on Oct 28 and $60.77 on Nov 11 both failed.
- Crossovers: The MACD bullish crossover (Nov 11) is the only fresh positive signal. +DI/−DI has not crossed, and −DI is still on top.
- Last two days: Price has faded from $60.77 to $53.13 (RSI 49.7 → 43.1). This is a failed push toward the EMA 21, and bulls need to defend the $48–50 zone.
CHART PATTERNS
- Descending channel / possible Bearish Flag: Since the October 9 breakdown, price has made lower highs and lower lows. The rally to $60–64 into the declining EMA 21 resembles a bearish flag or pennant continuation. A break below $43.66 would target roughly $35–38.
- Possible Bullish Double Bottom / Falling Wedge (unconfirmed): The $43–44 low, with a higher close at $48.4–49 and a spike to $60.77, hints at a base. The momentum divergences support this. Confirmation needs a close above the neckline at about $60–61, which would target the $66–70 zone (upper Bollinger Band, EMA 55). That is not yet in play.
- Significance: The structure favors a relief bounce toward $55–58 inside a larger downtrend. A full reversal is unconfirmed.
POTENTIAL SCENARIOS
- Scenario 1: Bullish Relief Bounce to the EMA 21 — Divergences, the MACD crossover and positive CMF support a mean-reversion move toward the Bollinger midline and EMA 21. Trigger: hold above $48.50 and close above $55. Target: $57–58 (EMA 21, with $60.77 as the stretch level). Invalidation: close below $48.50. (45% probability)
- Scenario 2: Bearish Trend Continuation — Price is rejected at the declining EMA 21 and the bear-flag channel resolves lower, with −DI still dominant and ADX above 25. Trigger: rejection near $57–58 or a break below $48.50. Target: $43.50 (lower band and prior low), then $38–40. Invalidation: daily close above $60.77. (40% probability)
- Scenario 3: Neutral Choppy Range — Price oscillates between $48 and $58 as volatility compresses after the capitulation. Trigger: failure to break either $48.50 or $58. Target: $52–55. Invalidation: close outside the $48–$58 band. (15% probability)
PRICE TARGETS
For the 20-day horizon (to Dec 5, 2026):
- Target Price: $55.00
- Expected Range: $50.00 to $56.50 (width $6.50, about 12.2% of the current price, in line with the 14–21 day guidance)
- Key Levels: Support at $48.50, Resistance at $57.63
OVERALL BIAS
OVERALL BIAS: BULLISH - Momentum is turning up: a MACD bullish crossover, RSI/MACD divergence versus the early-November low, and CMF at +0.102 (accumulation) favor a relief move toward the $55–58 area. Conviction is modest, since price is still below all major moving averages, −DI leads, and the death cross remains in place, so a failure below $48.50 would flip the view.
This is educational analysis and not financial advice.