CRWV 34-day bullish forecast — Nov 15, 2026
- Bias: Bullish
- Timeframe: 34 days (made Nov 15, 2026, target date Dec 18, 2026)
- Price at analysis: $53.13
- Price target: $55.50
- Expected range: $47.50 – $57.00
- Result: Pending — graded after the close on Dec 18, 2026
Get a free AI analysis of CRWV today
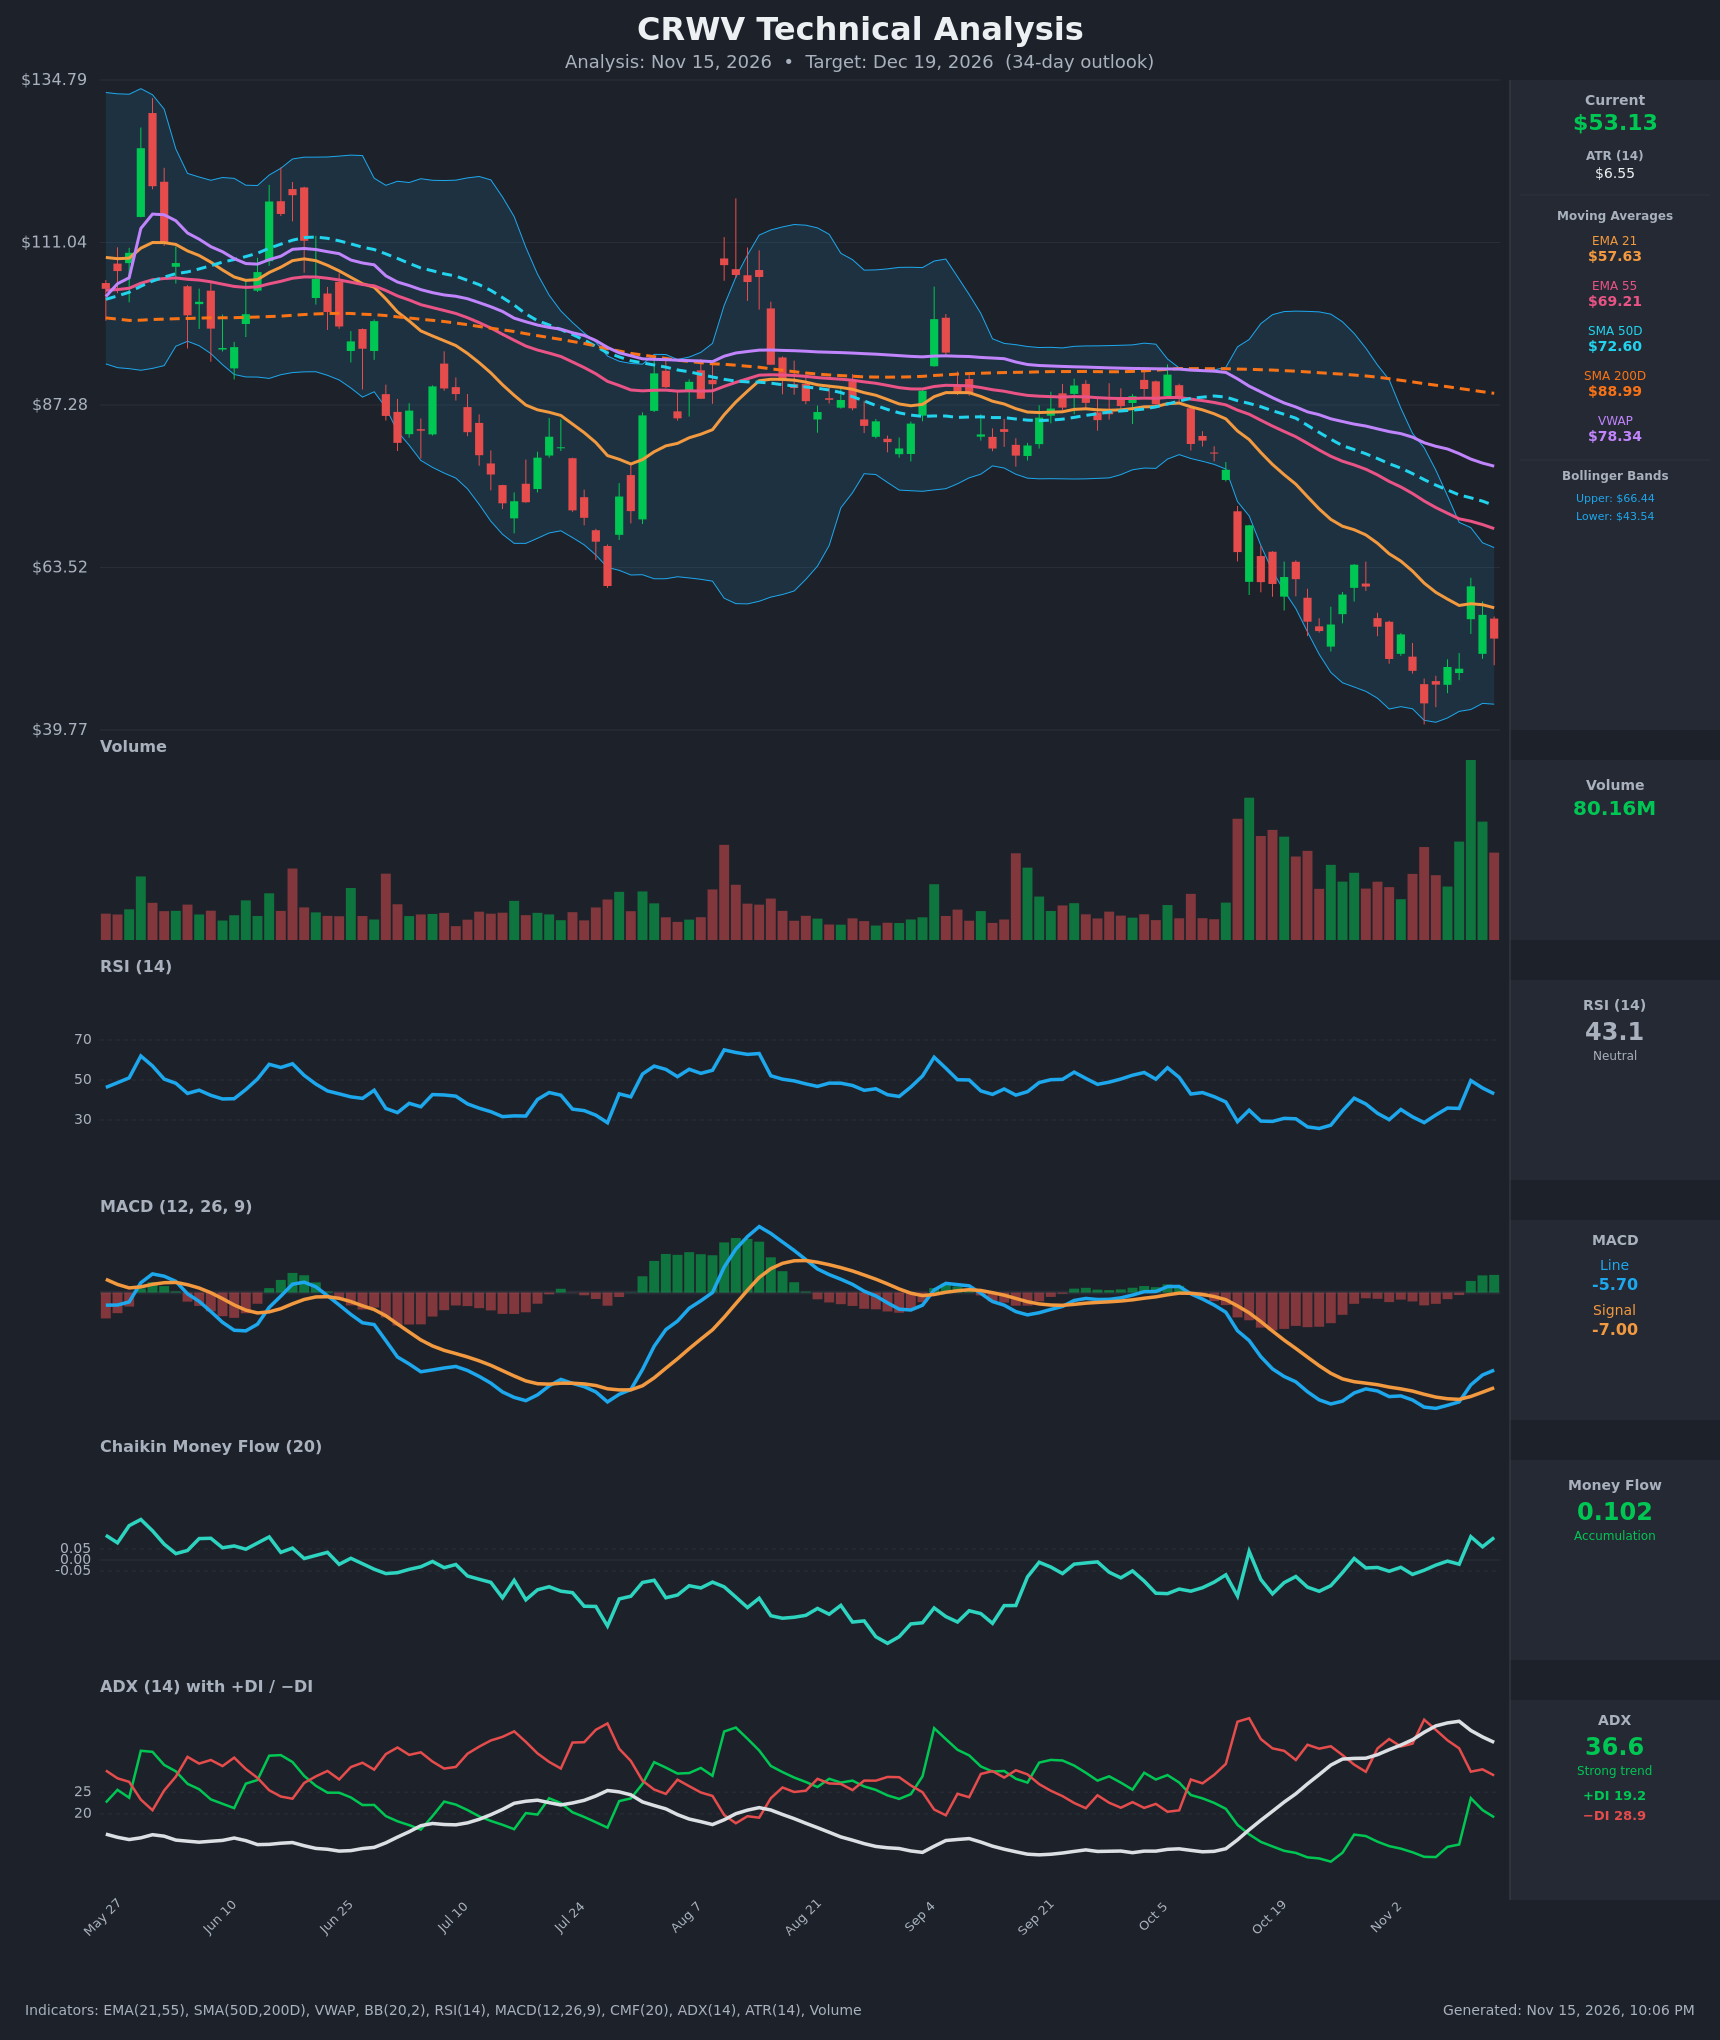
Analysis
TECHNICAL INDICATORS
- RSI (14): 43.11, up from the 28.7 low on Nov 5 and well off the sub-30 oversold zone. It faded from 49.7 on Nov 11, so the recovery is stalling near the 50 midline. The Nov 5 RSI low (28.7) was only marginally lower than the Oct 26 low (27.4) even though price made a lower low, a mild bullish divergence. [Neutral]
- 20 EMA: The 21 EMA is $57.63, above price at $53.13 and falling steeply (from $70.55 on Oct 26). It is dynamic resistance, and price was rejected near it on Nov 11-13. EMA21 ($57.63) is far below EMA55 ($69.21), so the bearish stack is intact. [Bearish]
- MACD: Line -5.70, signal -7.00, histogram positive and rising. The line crossed above the signal on Nov 11, which is a bullish momentum turn. It is still deep below zero, so this is relief momentum inside a downtrend, not a confirmed reversal. [Bullish]
- Bollinger Bands (20): Upper $66.44, lower $43.54, midline about $55. Price is just below the midline after tagging the lower band on Nov 5 ($43.66). The bands are wide and starting to narrow from the capitulation expansion. Price has recovered from the band floor but sits under the mean, which is typical of a bounce within a downtrend. [Neutral]
- CMF (20): 0.102, above the +0.05 threshold. It turned positive on Nov 11 and has held, so buying volume is absorbing supply despite the lower prices. This is a divergence against the trend. [Accumulation]
- ADX (14): 36.6, down from a peak of 41.5, so the trend is strong but beginning to mature. −DI (28.9) is above +DI (19.2), so bears remain in control, although the gap has narrowed from 41.8 vs 10.0 on Nov 5. [Strong Trend – Bearish, weakening]
- Volume: 80.16M, among the heaviest in the chart. It was a spike with the Nov 11 +24% bounce and elevated volume on the selloff, which suggests capitulation or climax. The recent bounce day was a heavy-volume green candle, but follow-through has been poor. [Capitulation/Possible Base, unconfirmed]
DIVERGENCES & TRENDS
- Bullish divergences: RSI made a marginally higher low (28.7 vs 27.4) while price made a lower low. CMF has flipped positive (0.102) while price remains near its lows. The MACD histogram is turning up from deeply negative territory.
- Trend structure: Price is below every moving average: EMA21 $57.63, EMA55 $69.21, SMA50D $72.60, SMA200D $88.99 and VWAP $78.34. SMA50D has been below SMA200D for a while (death cross in force), and the 21/55 EMAs are also bearishly aligned. The long-term trend is firmly down.
- Crossovers: The MACD bullish signal-line cross on Nov 11 is the only fresh positive crossover. +DI has not crossed above −DI, and no EMA or SMA crossovers have turned bullish.
- Price action: A sharp 22% bounce to $60.77 (Nov 11) was followed by two down days, so lower-high behavior is a risk. The $43.66-$46.40 zone is the swing low.
CHART PATTERNS
- Bullish Double Bottom (developing, speculative): Lows near $43.66 (Nov 5) and the earlier sub-$46 area form a possible double-bottom base. The neckline is roughly $60.77 (Nov 11 high). A close above it would target about $75-77 (measured move), well beyond a 34-day horizon.
- Bearish continuation context: The decline since early October resembles a bearish flag/pennant continuation, with the Nov 11-13 bounce as a failed counter-rally. A break below $43.66 targets the low $30s, with the measured move well below that.
- Significance: The chart shows a downtrend with early base-building signs but no confirmed reversal. Confirmation needs a close above $60.77 and the 21 EMA, and failure means a break below $43.66.
POTENTIAL SCENARIOS
- Scenario 1: Bullish Relief Rally to the Moving Averages — Capitulation volume, CMF accumulation, the MACD cross and RSI divergence support mean reversion toward the 21 EMA and the Bollinger midline/upper area. Trigger: hold above $48.40 and a daily close above $57.63 (EMA21). Target: $57-$60.77, with a stretch to $64-66 (upper Bollinger). Invalidation: close below $46.40, especially below $43.66. (45% probability)
- Scenario 2: Bearish Trend Continuation — The strong −DI-led trend (ADX 36.6) resumes as rallies get sold at falling EMA21 resistance. Lower highs confirm continuation. Trigger: rejection at $57-58 and a break below $48.40 followed by $43.66. Target: $40-$43, with extension toward the low $30s. Invalidation: close above $60.77 on volume. (40% probability)
- Scenario 3: Neutral Choppy Base — Price ranges between about $46 and $58 as the downtrend loses steam without a decisive reversal. Trigger: ADX falling toward 25 with price oscillating around the $55 Bollinger midline. Target: $48-$58 range. Invalidation: close outside $43.66-$60.77. (15% probability)
PRICE TARGETS
- Target Price: $55.50 (34-day horizon)
- Expected Range: $47.50 to $57.00 (width $9.50, about 17.9% of current price, consistent with the 30-60 day guidance)
- Key Levels: Support at $48.40, Resistance at $57.63
OVERALL BIAS
OVERALL BIAS: BULLISH - Capitulation-type volume, positive CMF accumulation, a bullish MACD cross and RSI divergence favor a modest relief rally toward the 21 EMA (~$57.6) over the next 34 days. Conviction is limited because the trend remains strongly bearish (−DI over +DI, price below all MAs), and a break below $43.66 would invalidate the view.
This is educational analysis and not financial advice.